October 2026 Turkiye Second-Hand Market Panorama with Data
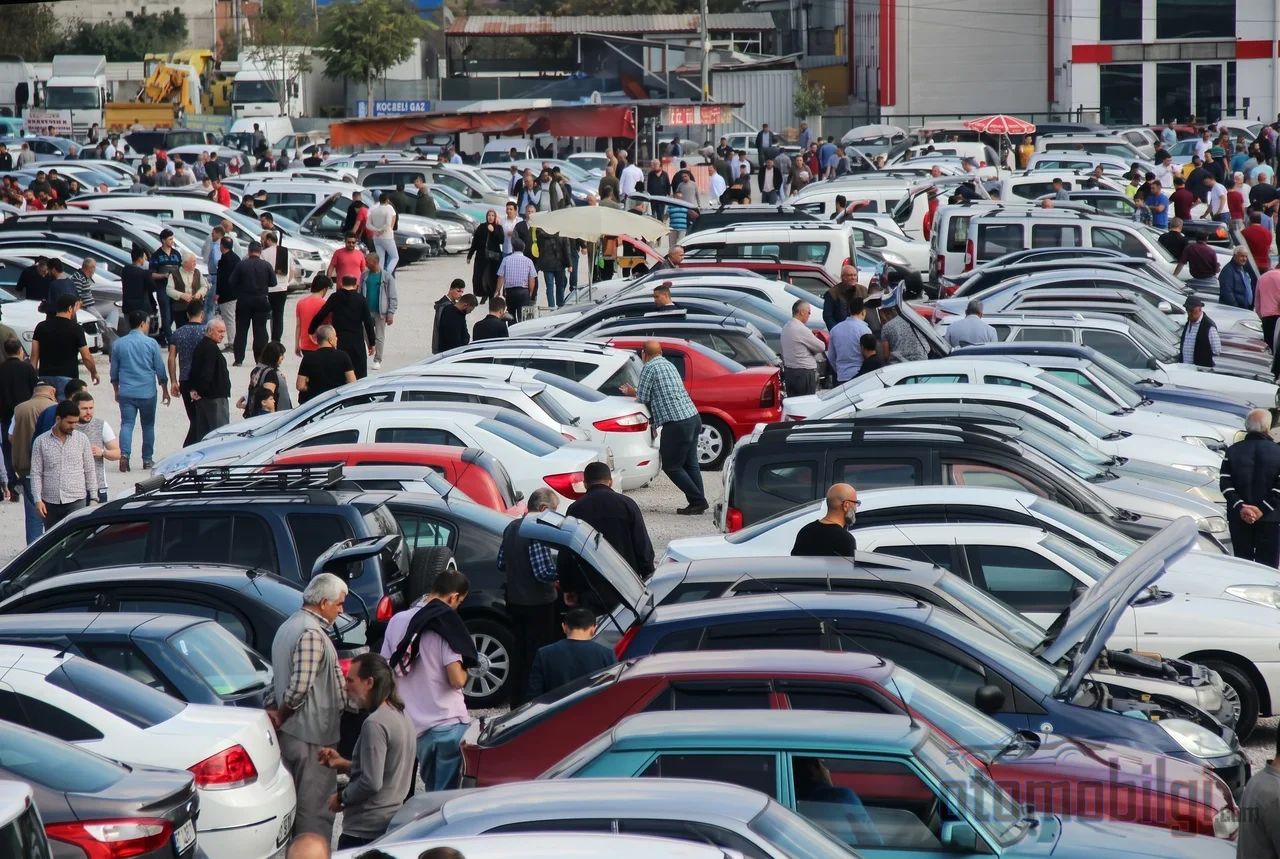
The October used-car listing table, as usual, gives a mixed signal to anyone who has long been part of this market: the average price tag in listings is rising nominally, but when you factor in inflation, the real value of the vehicles is slipping. arabam.com's monthly price index, shared on November 16, 2026, shows that the average listing price climbed to 926,771 TL in October; in September, that figure was 921,307 TL. So on paper there is an increase of around 0.6 percent. However, in real terms the picture reverses: when adjusted for inflation, used-car prices fell 1.94 percent in October compared to the previous month. It appears that what is actually pushing the market down is not the price tag, but a discount race. In this article, we cover the details of October's data, the distribution of price brackets, which models stand out in supply, and how zero-kilometer campaigns and tight credit are reflected in the used-car market.
Are Used Car Prices Falling? Nominal Increase, Real Decline
The short answer to this question depends on which measure you look at. Nominally, the average used-car listing price rose from 921,307 TL in September to 926,771 TL in October. But the general rise in price levels overshadows this; inflation-adjusted data shows that real prices eroded by about 2 percent in October. So while the seller's tag often stays slightly above the old price, the listing's real purchasing-power equivalent in the market slips a little lower every month.
What is more striking is that prices are being pulled down not only on paper but in practice. According to data from the listing platform, the share of listings with price reductions increased in September and October; in October, this increase exceeded 10 percent compared to the previous month on both the individual and corporate seller sides. With the number of listings constant, the acceleration of price revisions is a clear sign that sellers have begun to prefer making a deal rather than waiting. What dealers report about a difficult year and leftover stock also confirms this.
Highlights
- Average used-car listing price in October: 926,771 TL; nominal increase from September, 1.94 percent real decline when adjusted for inflation
- 55 percent of listings carry prices under 1 million TL
- The share of listings with price reductions in October increased by more than 10 percent compared to the previous month, on both individual and corporate sides
- The model with the most listings is the Renault Clio; in the brand ranking, Renault, Fiat and Volkswagen lead the way
- Used-car transfer transactions in October: 597,133 units: approximately 9.6 times the registrations of new cars
55 Percent of Listings Under 1 Million TL: Distribution of Price Brackets
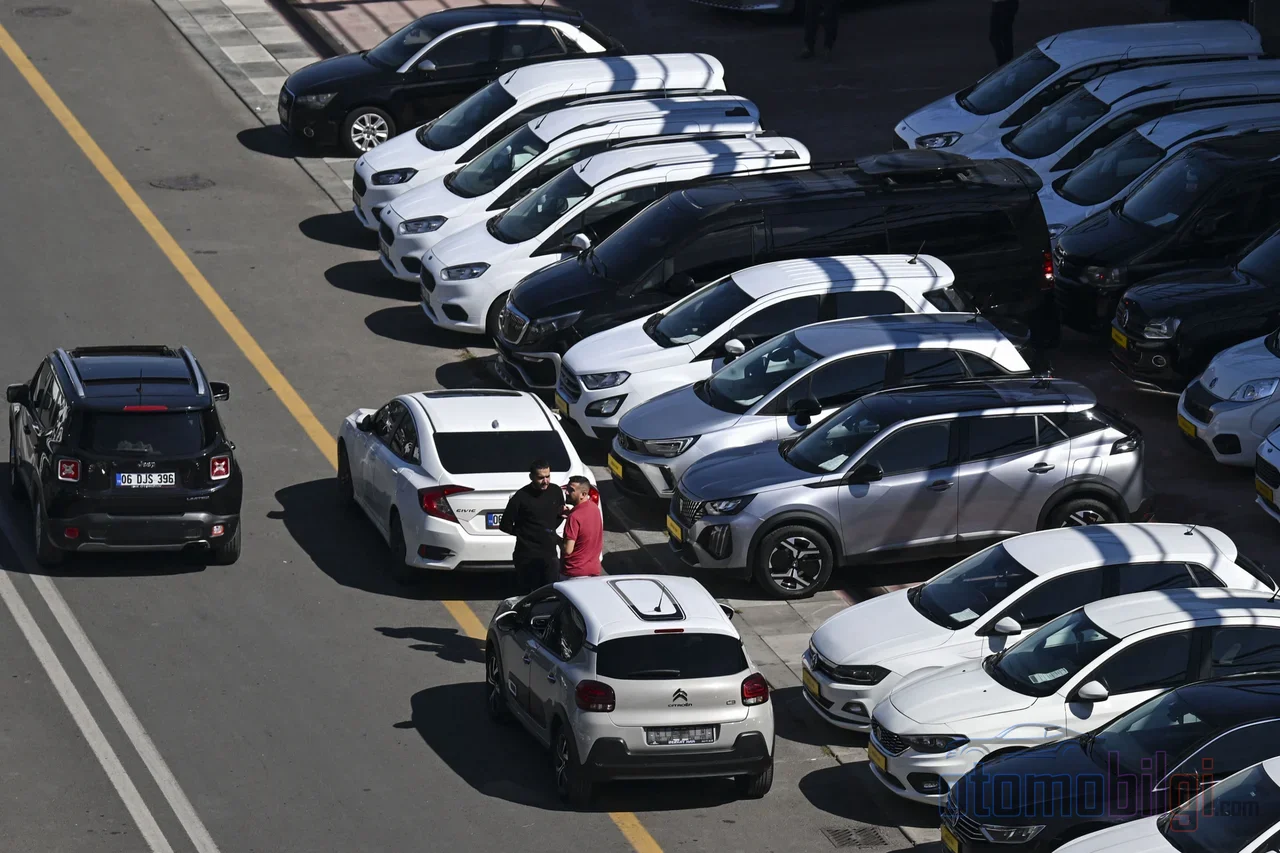
The price distribution of October listings shows that the market's center of gravity still sits in reasonable brackets. The distribution is as follows:
| Price bracket | Share of listings |
|---|---|
| 600 thousand TL and below | 29 percent |
| 600 thousand - 1 million TL | 26 percent |
| 1 - 1.4 million TL | 20 percent |
| 1.4 - 1.7 million TL | 10 percent |
| 1.7 million TL and above | 15 percent |
In total, 55 percent of the listings are priced under 1 million TL. So the answer to the question "can you find a car for under 1 million TL" is still a strong yes on the supply side. On the other hand, the 1.7 million TL and above segment accounting for 15 percent shows that the upper end of the market is not made of scraps either; but the volume is mainly concentrated in the lower and mid segments.
The age distribution also points in the same direction. In October listings, vehicles aged 5 years and under accounted for 27.8 percent, while vehicles between 10-15 years old accounted for 30 percent. The observation that interest in older vehicles is increasing is also consistent with this weighting on the supply side: buyers whose budgets have narrowed in the face of credit restrictions and new car prices are turning to relatively older models with more accessible price tags.
The Most Listed Brands and Models
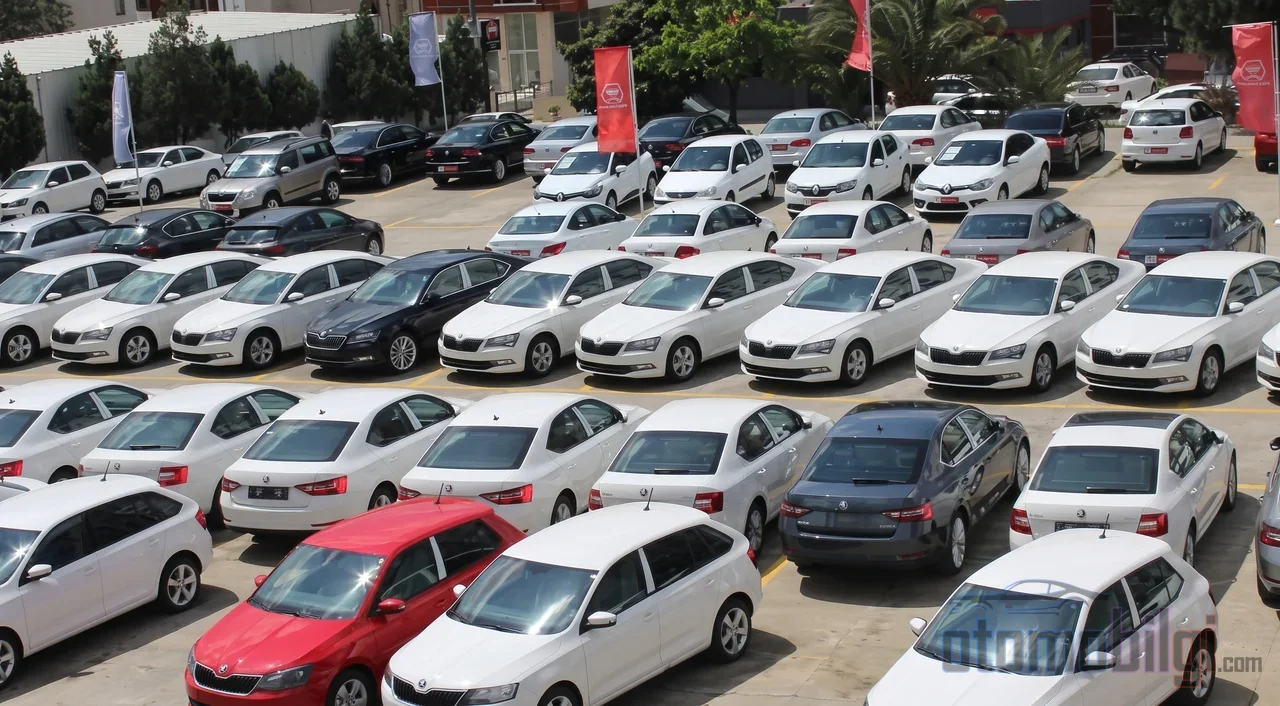
The supply side's inventory hasn't changed; the names that have formed the backbone of the second-hand market in this country for thirty years were also at the top of the list in October. In the brand ranking, Renault, Fiat, Volkswagen, Ford and Opel formed the top five; they were followed by Hyundai, Peugeot, Toyota, BMW and Citroen. There was a time when we would see different faces in the front ranks of the market, but the result is not surprising: widespread service networks, cheap parts and proven reliability make themselves felt on the listing side too.
The most listed vehicle by model was the Renault Clio. It was followed by the Megane, Egea, Corolla, Astra, Focus, Passat, Civic, Polo and Corsa. The details of the ranking are also revealing: the Focus's place in the upper ranks shows that relatively newer-generation vehicles are starting to enter the supply; the permanent presence of the Corolla and Civic on the list reflects the unchanged demand in the mid-size sedan market. The practical meaning for the buyer is this: there are plenty of options in these models, and the room for bargaining is wider where interest is high.
Corporate Sellers, New Car Campaigns and the Discount Race
The most significant breakdown of the October data is that it shows where the price pressure is coming from. Corporate sellers' goal of liquidating inventory and accelerating cash flow creates downward pressure on listing prices. In addition, discount and financing campaigns on new vehicles are creating serious competitive pressure especially on near-new second-hand vehicles: when new car prices show a floor movement, a one-to-two-year-old second-hand car cannot stay in the same range.
On the listing numbers side, there is a stagnant balance. The total number of corporate listings published in October was measured at 470,092; this is almost exactly the same level, with a difference of only 0.1 percent compared to the same period last year. In short, the supply volume neither noticeably swelled nor shrank; what changed is not the quantity, but the pricing behavior. This indicates that the discount race is not a temporary fluctuation but the combined result of stock costs and campaigns on the new car side.
Credit Crunch and New Car Prices: The Equation That Determines the Used Market
1 New Car vs 9.6 Used Cars
In October, new car registrations fell by 29.1 percent, dropping to 62,097 units. In the same month, 597,133 ownership transfer transactions took place in the used car market; the used car transaction volume was approximately 9.6 times the new car registrations. Across Türkiye, automobiles accounted for 68.3 percent of a total of 873,545 vehicle transfers. This rate clearly shows that the market's center of gravity lies on the used car side; used car sales reaching 1.84 million units in the third quarter also supports the same picture.
The Gap Between Credit Limits and Prices
The structural problem of the market is the gap between prices and financing. The average new car price has reached the level of 2 million TL; in contrast, the individual vehicle loan limit is around 300 thousand TL, and the use of credit is already prohibited for vehicles over 2 million TL. For internal combustion engine vehicles, credit limits largely operate according to the tiers set in 2022; for many gasoline and diesel models, there is no term longer than 12 months. Industry representatives are calling for credit limits and tax regulations to be reviewed, both for the wider adoption of electric vehicles and for the market to recover; battery health, reliable inspection services, and access to financing are also among the current topics on the used car side.
Ultimately, in a market with low credit and high prices, buyers are pushed toward used cars. But this demand flowing into the used market faces price pressure due to campaigns on the new car side: when everyone tries to sell at the same time, the side that lowers the price rather than maintaining discipline wins. The 24.33 percent contraction of the car and light commercial vehicle market in September, with the C segment standing out with a 56.1 percent share and the B segment with 28.3 percent, also shows where demand is squeezed.
Summary of the October Panorama: What Does It Say to Buyers and Sellers?
When we read the October picture as a whole, a clear summary emerges: while nominal prices in the used car market rise slightly, real prices are falling by 1.94 percent; 55 percent of listings are listed below 1 million TL; price revisions accelerated on both the individual and corporate sides; supply volume remained almost flat on an annual basis. The honest answer to the question "Are used car prices falling?" is this: the price tags are not coming down, but the real value of vehicles is slipping a little lower every month thanks to inflation and the discount race.
For buyers, this is a period of abundant options and increased bargaining power, though financing still flows through a narrow pipe. For sellers, especially on the corporate side, the cost of waiting is an equation that grows every month. As long as new car campaigns continue and credit limits are not relaxed, it is believed that competitive pressure on new models in the used market will not diminish. The common consensus of those who have been through the thick of this business does not change either: the market isn't going through a sharp correction, but those who set their price realistically rather than patiently are the ones who win.
Sources
- 55 percent of the used market is below 1 million TL
- The balance in the used car market is shifting
- 10 used cars for every 1 new one: The entire equation in the automobile market has changed
- October data in the used car market
- Financing reality in automotive lags behind the market
- Consumer loan maturity limits and down payment rates 2026
- ODMD Press Release September 2026
- Best-selling used car models in Türkiye
- Have used car prices dropped?