Charging Curve: Why Does Power Drop as the Battery Fills?
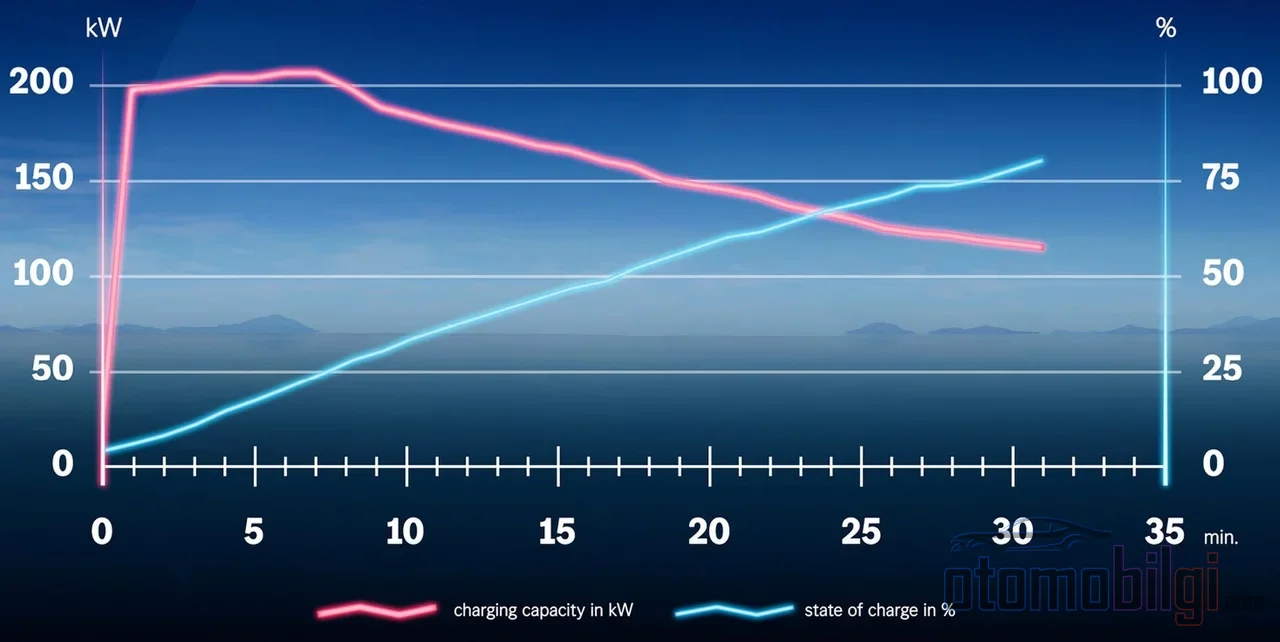
The 150 kW value displayed on the screen in the first minute you plug into a charging station doesn't stay the same ten minutes later; once you pass 80%, the number can drop to half or even lower. Most drivers think it's a malfunction or believe the station broke its promise. Yet the drop on the screen is one of the best-documented behaviors in the electric vehicle world: the charging curve.
This page explains, with its technical logic, why the power drawn gradually decreases as the battery fills, and compares the duration between the two segments extending from 10% to 80% and from 80% to 100% with concrete scenarios. By the end, you'll be able to read the kW graph at the station with your own eyes and plan your break strategy accordingly.
What Is the Charging Curve, and Why Does the kW Value on the Screen Keep Changing?
The charging curve is a graph showing the relationship between the battery's instantaneous state of charge (SoC) and the charging power (kW) obtained at that point. It does what its name suggests: there is no constant speed; the battery cannot accept maximum power throughout the entire session; the rate decreases gradually. Nearly every electric model on the road today uses this slowing curve.
Behind the curve lies a two-phase mechanism. Until the SoC reaches approximately 80%, the vehicle charges in constant current mode; the highest possible current up to a certain voltage is sent to the cells. When the cell voltage reaches this upper limit, the system switches to constant voltage mode and the battery management system (BMS) actively reduces the current. The power must decrease for physical reasons: power is the product of current and voltage, and when the voltage hits its ceiling, current is the only variable left to adjust.
Highlights
- The taper usually becomes noticeable around 80%, but 80% is not a strict limit; it is a reference point that varies from vehicle to vehicle.
- The Ioniq 5 promises 18 minutes for 10-80% on a 350 kW unit in its brochure; the vehicle draws about 263 kW at peak, with an average of 205 kW.
- The ideal operating temperature of most lithium-ion batteries is between 20-40 °C; below +10 °C, charging slows down noticeably.
- A vehicle with a 400 V architecture is limited to about 180 kW at a DC unit capable of delivering up to 360 kW.
The curve doesn't have a single shape; it's most instructive to think of it as a three-segment progression. At low SoC (0-10%), power is sometimes restricted to protect the pack or due to low cell voltage. In the middle region, in the window extending from about 10% to 50-60%, the curve is at its fastest. Between 60-80%, the taper begins, and between 80-100%, charging slows down significantly to protect battery health.
Why Does the BMS Reduce Power: Heat, Voltage, and Cell Protection Logic
The taper is not a malfunction; it's an extremely intelligent protection mechanism. Sensitive lithium-ion cells must not overheat, must not be overcharged, and must be protected from premature aging. As the battery fills, the cells become more sensitive; sending high current to a cell approaching the upper voltage limit risks the pack staying healthy for long years. The BMS eliminates exactly this risk by reducing the current in stages.
The Effect of Temperature on the Curve
Temperature shapes even the first half of the curve. In a cold pack, internal resistance increases and the BMS limits the current: a unit that can support 150 kW may initially show 30-60 kW, and power rises as the pack warms up. In a very hot pack, the opposite happens; repeated fast charging or hot weather causes the system to reduce power to prevent overheating. The ideal window for most lithium-ion batteries is 20-40 °C; roughly 20-25 °C is the most efficient band, and charging slows below +10 °C.
Modern vehicles solve this problem with preconditioning: when a charging station is entered into the navigation, the vehicle brings the battery to the ideal temperature before you arrive, and to get the best result this process needs to start about 30 minutes earlier. Driving alone or cabin air conditioning changes the battery temperature only slightly. Some manufacturers go one step further; for example, Tesla can heat the pack up to 50 °C during fast charging.
Vehicle-Side and Station-Side Limits
Every model has a maximum charging power set by the manufacturer and its own programmed charging curve. The vehicle can slow down with its own limit well before the charger's limit. Voltage architecture is also decisive: since power is the product of current and voltage, a DC unit capable of delivering up to 360 kW can offer a 400 V vehicle only about 180 kW; while vehicles with an 800 V architecture can see values close to the unit's maximum power.
On the station side, too, there is a factor that reduces your share: dynamic load management. A location with 200 kW of connected power can share that power dynamically among multiple vehicles charging at the same time; the value on the screen reflects your share at that moment. In short, the kW on the screen is the intersection of your battery's, your vehicle's and the station's limits at that moment.
The Time Difference Between 10-80% and 80-100%: Concrete Scenarios
Simple calculation deceives you. Filling 40 kWh of energy with a 50 kW unit comes to 0.8 hours in the formula, i.e. 48 minutes. But this calculation assumes the power stays constant throughout the entire session; in the real world, the curve makes the result deviate from this value. The comparison below shows why the two halves of the same session are not equal.
| SoC Range | State of the Curve | Time Character |
|---|---|---|
| 0-10% | Protected, sometimes restricted | Short but not the peak |
| ~10-50/60% | The fastest section | High kW value sustained for a long time |
| 60-80% | Start of the taper | Power drops gradually |
| 80-100% | Constant voltage mode | Disproportionately long |
This is exactly why it is recommended to end a fast-charging session at around 80%: the remaining 20% takes disproportionately long because the curve flattens. The last 10-20% can take as long as the first 40-50%. In numbers, a vehicle whose brochure says 18 minutes for the 10-80% window adds much less energy beyond 80% in the same time; a 100% target can multiply your break time.
That's why there's a bold proposal in the road trip strategy debate: Instead of waiting up to 90-100% at DC fast charging, leaving at around 60-70% and taking shorter but more frequent breaks is generally more efficient in terms of time. Due to the rising taper, every additional percentage fills more slowly than the previous one; the fastest energy flows in the middle of the curve.
Does Taper Start at the Same Point in Every Vehicle?
No. The taper starting point varies by vehicle type; in one example study, charging enters the voltage control regime at around 60% SoC. 80% is not a hard limit, but a common threshold where charging slows noticeably: speed usually starts dropping before 80%. Also, manufacturers' curve profiles differ from one another; some vehicles reach peak power faster, some hold high power for longer, some drop sharply while others decline gradually.
This difference is the result of a historical development. About a decade ago, 50 kW was the industry standard for both vehicles and chargers, and the curves of older EVs were not as optimized as today's. Today, the literature compares early-taper, standard, and flat profiles according to different SoC levels; if you want to see your own vehicle's actual curve, model-based fast charging profiles may appear in published data sets. The most practical method, however, is simple: at your next DC charge, take a photo of the screen and note the kW against the SoC; then you'll have your vehicle's curve in hand.
Why Isn't the Curve Felt in AC Charging?
The fundamental difference between AC and DC charging curves is how much power the battery can accept over time. In AC charging, the conversion is done by the vehicle's own on-board charging unit, and the power itself is already low; battery temperature and charging curves do not play a determining role. That's why the curve is not noticeable in AC, while it is clearly felt in DC fast charging.
There's another practical side effect of this: on the AC side, it's usually the vehicle that sets the limit. A 22 kW wallbox will never show above 11 kW if the vehicle's internal charging unit is 11 kW; some models are limited to 7.4 kW, or even 3.7 kW. Portable cables limited to 10 A or 16 A can also restrict power. So what a driver who wants to experience the slowdown after 80% should be curious about is the curve in DC; and in AC, it's the power of the vehicle's internal charging unit.
Is Stopping at 80% Really Necessary for the Battery?
The question sparks a legitimate debate. On one side, some manufacturer manuals recommend charging to 80% for daily use more than once; for example, one model's manual explicitly includes this recommendation. On the other side, electrochemical measurements soften the picture: it has been measured that after 1000 cycles, the battery health difference between a pack kept at 80% and one charged to 100% was only 0.4 points. In other words, the 80% habit is a recommendation aimed at the extra wear caused by full charging; it's not an absolute red line.
The concluding sentence is the direct answer to the question at the top of the page: Charging slowing after 80% is due to the BMS progressively reducing the current in constant voltage mode as cell voltage approaches its upper limit while the battery fills; it is not a fault, but a mechanism that protects the battery from overheating and premature aging. What you see on your screen when the kW figure drops is your vehicle managing its own lifespan.
How Should You Read the kW Graph at the Station?
- A low value at low SoC or with a cold pack is an indication of the warm-up and protection window, not a fault; once the pack is prepared, the power rises.
- The peak value does not have to equal the number on the station's sign; the vehicle's maximum power, its voltage architecture, and the dynamic load sharing at that moment are what determine it.
- The decline beginning before 80% is natural; 80% is the typical but not absolute threshold of the taper.
- On a long journey, the most efficient break is one taken on the fast section of the curve; a short break at 60-70% generally saves time compared to waiting until 100%.
Sources
- EV charging curve: Why charging speed fluctuates
- What Your EV Charging Time Calculator Doesn't Tell You
- EV battery charging: power, charging curves and charging time
- What is an electric car charging curve?
- Modeling Charging Curves and Output Capacity
- Energy Storage for DC Fast Chargers
- Why do EV fast chargers slow once the charge hits 80 per cent?
- Controlling thermal conditions for DC fast charging reliability