Real-World Battery Life Data from 22,700 Electric Vehicles
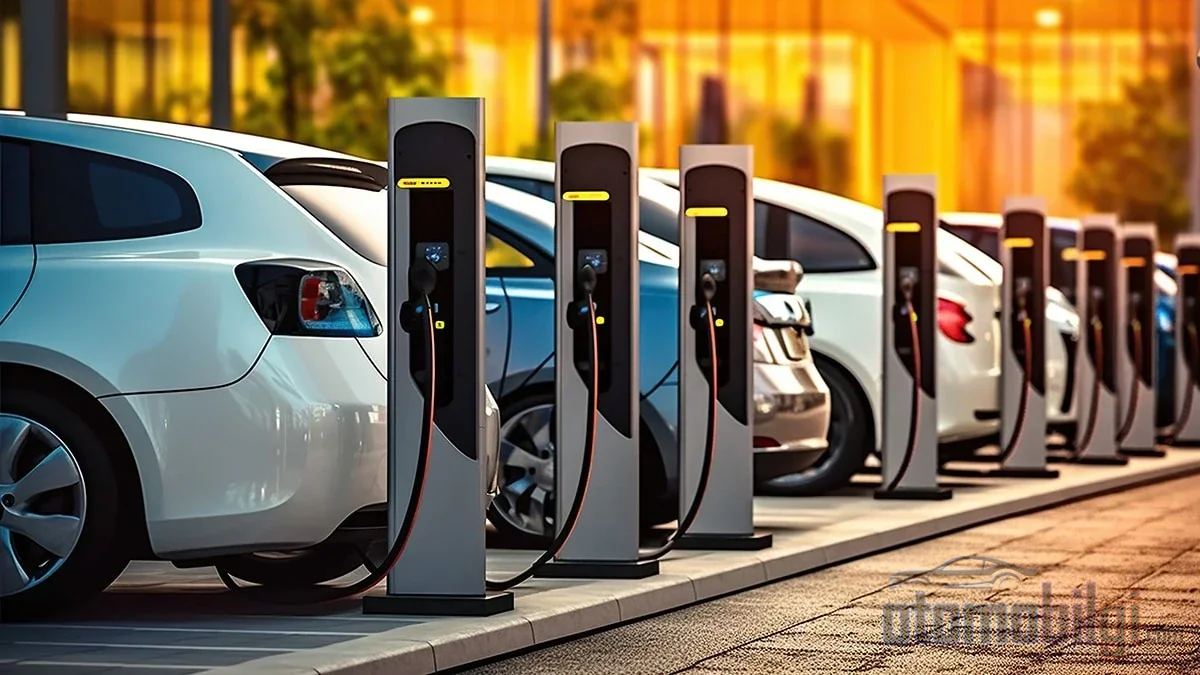
The warning we hear most often when considering buying an electric vehicle is the short battery life predicted under laboratory conditions: a thousand charge cycles, a few years, followed by an expensive replacement. Yet fleet telemetry data paints a completely different picture. Real-world usage data from more than 22,700 electric vehicles across 21 different models shows that an average battery still retains most of its usable capacity after roughly 6.5 years of use. So what does this number mean, which habits disrupt the picture, and how does the difference between hybrids and plug-in hybrids affect battery health?
What the fleet data says: Where is the battery after 6.5 years?
The 2025 update of telemetry data collected from electric vehicle fleets puts the average annual battery degradation rate at 2.3%. In practice, this rate means the following: an average battery retains roughly 85-90% of its capacity after about 6.5-7 years of use; after eight full years, its state of health (SOH) drops to the 81.6% level. This observed rate means the battery could last 13 years or longer.
Highlights
- Average annual degradation of 2.3%; 85-90% of capacity retained after 6.5-7 years
- Projected average battery health of 81.6% SOH after 8 years
- High-power DC fast charging increases degradation by up to twice as much compared to low-power charging
- Packs without active cooling age noticeably faster in hot climates
- A full hybrid does not need to be plugged in, while a plug-in hybrid requires external charging; the difference lies in battery size and electric range
The history of these figures is also noteworthy. In the 2020 analysis, the rate was also 2.3%; in 2023, when calculated across 11 models, it fell to 1.8%, and established models in the same data set settled at a level of 1.4% per year in the long run. In other words, technology is progressing in one direction: advancements in thermal management systems and improvements in battery chemistry are slowing down aging.
The sharp drop in the early years is misleading
The degradation curve is not linear. Many electric vehicles experience a sharper capacity drop in the first 1-2 years, after which the rate settles and stabilizes. A user who panics upon seeing the first-year drop misses the real point: the long-term trend does not continue as it did at the start. For this reason, when buying a used electric vehicle, you should look at the SOH value rather than the mileage.
The need for battery replacement is also far rarer than the myth suggests. According to real-world usage data, excluding major recalls, the battery replacement rate across all years and models is below 4%. While this rate was about 8.5% in first-generation electric vehicles, it dropped to 2% in early second generations, and falls to 0.3% in modern vehicles from 2022 onward. A brief comparison table clarifies the summary of the picture:
| Vehicle generation | Battery replacement rate |
|---|---|
| First-generation EV | ~8.5% |
| Early second generation (early Bolt, Model 3) | 2% |
| Modern EVs from 2022 onward | 0.3% |
Fast charging and temperature are more decisive than age and mileage
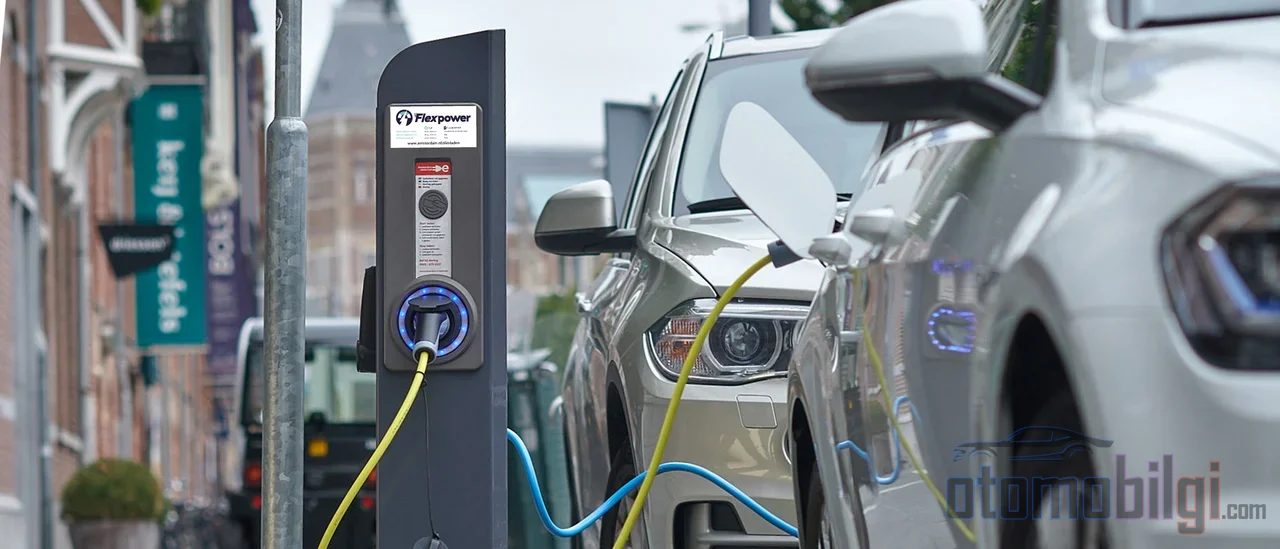
Perhaps the most valuable finding from the fleet data is this: what determines the battery's aging rate is not the vehicle's age or mileage, but how it was charged and at what temperature it operated. DC fast charging exceeding 100 kW is the single largest stressor in the dataset. While vehicles fed with low-power charging lost 1.5% per year, this rate could climb up to 3.0% in the high-power fast-charging group; the projected health after eight years was 88% in the low-power group and 76% in the high-power group.
Frequency matters as much as power. Vehicles using less than 12% of DC fast charging sessions lose 1.5% per year; for those exceeding the 12% threshold, the rate rises to 2.5%, and among those where sessions above 100 kW exceed 40% within high frequency, it climbs to 3.0%. Translated into everyday language: slow charging on weekdays, fast charging only on long trips, seriously protects battery health.
There is also an honest nuance here: some studies found no statistically significant difference in range loss between Teslas that fast-charged and those that did not. The matter is not entirely settled; vehicle model, battery chemistry, and thermal management quality can change the outcome. Still, the predominant finding is clear: high current and high temperature accelerate side reactions in the cell chemistry.
Temperature: the real enemy, the source of permanent damage
Vehicles operating in hot climates experience approximately 0.4% faster degradation per year compared to those in temperate climates. Temperature increases chemical activity within the cells; although the battery management system (BMS) tries to limit this effect, it cannot eliminate it completely. The effect of cold weather is largely temporary: the slowing of chemical reactions and the extra energy consumed by cabin heating temporarily reduce range, and this loss largely returns once the pack warms up. There is no strong evidence that cold alone shortens battery life.
The difference between active and passive cooling
The importance of thermal management is seen most strikingly in the fate of passively air-cooled packs. Some well-known models with passive cooling experience noticeably faster degradation because their cooling capacity is insufficient in extreme heat; passive ambient air cooling has been almost completely abandoned in modern electric vehicles. Active systems ranging from fan-forced air cooling to liquid cooling extend battery life. Part of the improvement in the 2023 analysis is also directly attributed to evolving thermal management systems. When evaluating a vehicle, the battery pack's cooling method is a technical detail as decisive as horsepower.
Is the 20-80 rule really necessary?
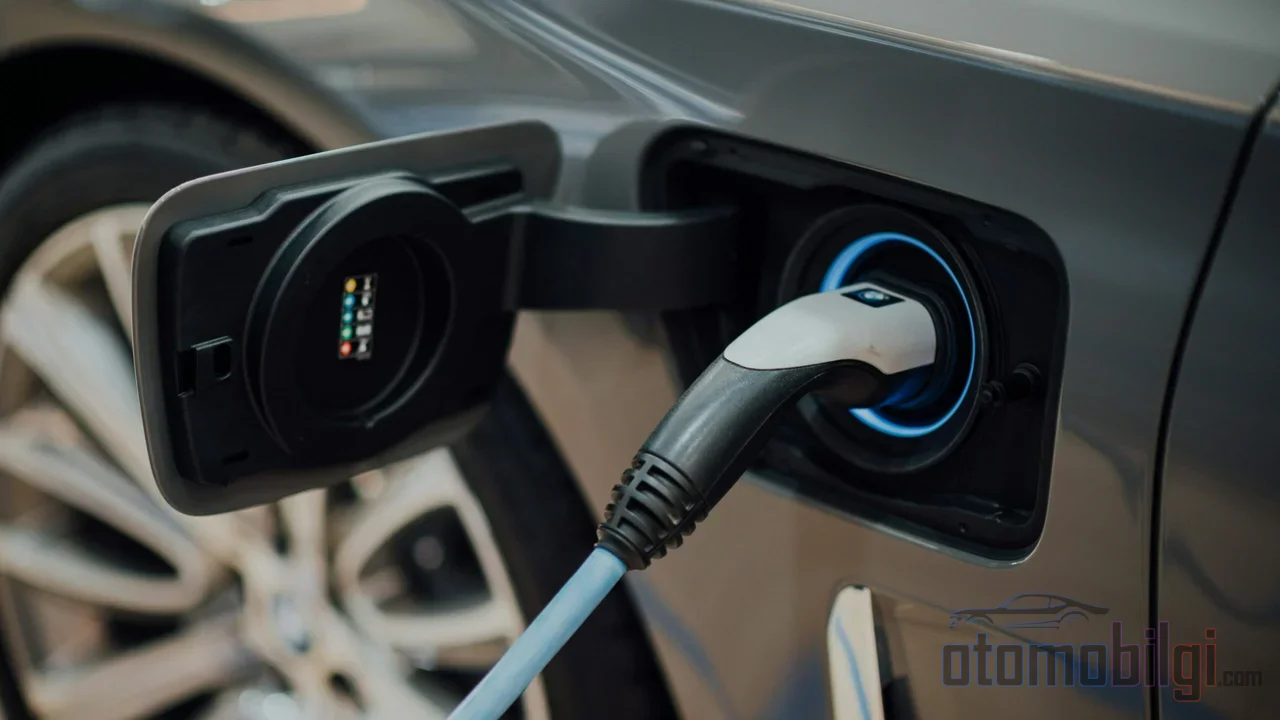
The rule of keeping the charge level between 20% and 80% is one of the most deeply rooted habits in electric vehicle culture. The data largely puts minds at ease: degradation only accelerates noticeably if the vehicle spends more than 80% of its total time at fully charged or fully empty levels; even in that group the rate is around 2.0% per year. The reason is simple: modern batteries have software buffers at the top and bottom ends, and the indicator's 100% does not mean chemically full. In daily use, a strict limit is unnecessary; leaving the vehicle at a mid-level only makes sense if you are going to park it full or empty for days.
The effect of usage intensity is measurable: vehicles consuming more than 35% of capacity per day, doing a full cycle every one or two days, experience roughly +0.8% extra annual loss compared to low-usage ones (2.3% instead of 1.5%). After eight years, this difference materializes as 81.6% SOH versus 88%. So there is a heavy-use penalty, but it is not dramatic.
Full hybrid and plug-in hybrid: how does the charging difference affect health?
In the hybrid world, there are two different battery lifestyles. A full hybrid (HEV) cannot be plugged in; it draws the energy for its traction battery from regenerative braking and the internal combustion engine. A plug-in hybrid (PHEV), on the other hand, requires external charging; the difference is primarily in battery size and all-electric range. PHEVs typically offer an electric range of around 25 miles (about 40 km) per charge, while HEVs provide short electric assistance limited to a few kilometers.
This difference works in two directions in terms of battery health. An HEV's small battery lives on continuous small cycles; regenerative braking provides energy recovery effective enough to extend brake pad life beyond 160,000 km. However, the academic finding is two-sided: the charging current from regenerative braking is a significant factor in long-term battery degradation regardless of current level; on the other hand, strong regeneration can reduce discharge depth, extending life even at high charge levels and temperatures. In practice, hybrid batteries operate accustomed to small pulses, with regeneration being severely throttled once SOC exceeds about 70-75%. A PHEV battery, meanwhile, is larger but condemned to always operating at the full-empty extremes when used without plugging in, so a regular and measured charging habit makes a bigger difference here.
On the chemistry side, second-hand hybrids most likely come with nickel-metal hydride (NiMH) packs: a long-proven technology suited to a 10-20 year life target and economical. Lithium-ion offers higher energy density, is lighter and more compact but more expensive; its share keeps increasing. Both chemistries are treated equally in manufacturer warranties.
Warranty and replacement cost: the financial side of the picture
The warranty network is the most concrete answer to battery anxiety. The market standard is an 8-year / 100,000-mile warranty, and most manufacturers activate the warranty when battery capacity drops below 70% of its original value. Some manufacturers extend this up to 10 years / 100,000 miles. Considering that the warranty threshold is 70%, with an average annual loss of 2.3%, reaching that threshold could take decades.
The replacement cost varies by vehicle type: hybrid battery replacement averages $2,000-8,000, while an electric vehicle battery ranges from $5,000-22,000. These figures are on a downward trend; pack-level costs are projected to fall to around $50/kWh by 2030. Additionally, between 2015 and 2024, average battery sizes grew by 167%; manufacturers unlocking reserved capacity via software updates means that the displayed range does not exactly mirror actual battery aging.
The straightforward answer: What state will your battery be in after 6.5 years?
The question can be answered in a single sentence: according to real-world data, an average battery retains about 90% of its capacity after 6.5 years of use; after eight years, the average health level is projected to be 81.6%, and the need for replacement in modern vehicles is measured in a few tenths of a percent. What ages a battery is not the vehicle's age, but the frequency of fast charging above 100 kW, high temperatures, and the absence of active cooling.
This yields three practical takeaways for the reader. First: save fast charging for long trips; slow charging is enough for daily life. Second: a user living in a hot climate or parking the car full in the sun during summer months solves most of the problem by choosing a pack with active liquid cooling. Third: on the hybrid side, a non-plug-in full hybrid keeps its small battery healthy by feeding it with regenerative braking, while a plug-in hybrid draws the healthiest curve with regular and moderate home charging. Battery life is not a fate; it is an engineering parameter that can be managed with the right habits.
Sources
- EV Battery Health: Key Findings from 22,700 Vehicle Data Analysis
- New Data: How Long Do Electric Car Batteries Last?
- Real-World Data Shows EV Batteries Built to Last
- Hybrid Electric Vehicles - Alternative Fuels Data Center
- Hybrid vs Plug-in Hybrid Vehicles: What's the Difference?
- Effect of Regenerative Braking on Battery Life
- How Long Do Hybrid Car Batteries Last
- Car Warranty Coverage for Hybrid and EV Batteries
- The effect of active and passive battery thermal management
- Electric Car Battery Replacement Cost in 2026