Frequent Short Charging or Long Full Charges? What the Data Says
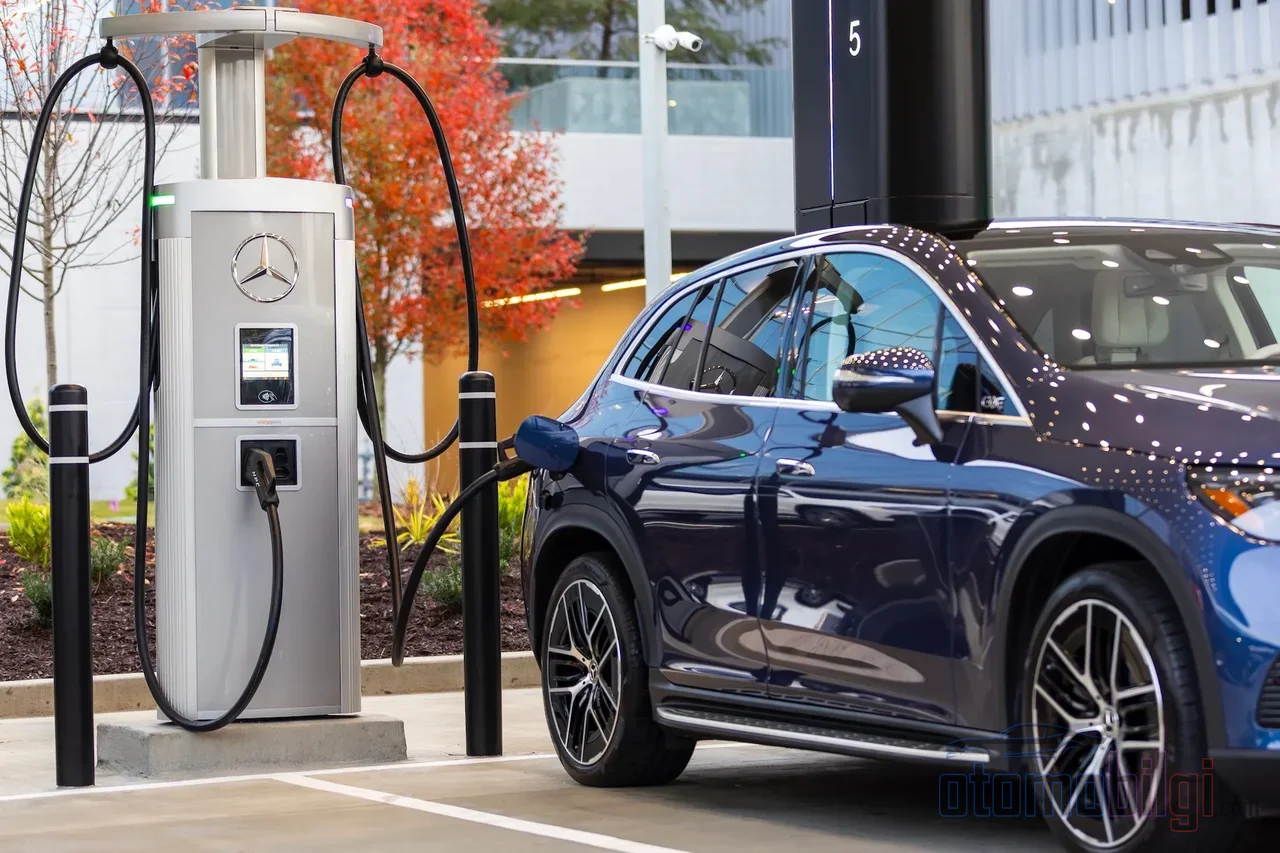
The most debated decision for an electric vehicle driver setting out on a long journey is not the range itself, but how to split up charging: should you fill the battery to the top at two stations, or make four short stops and stay in the efficient zone of the fast-charging curve? The choice is less arbitrary than most drivers think, because the answer lies in the physical operating principles of the battery. The same vehicle, on the same route, can finish its door-to-door trip in noticeably different times with two different tactics.
On this page, we compare the two strategies along the axes of charging curve, number of stops, instantaneous charging power and driver fatigue, and clarify with concrete data which one wins in which scenario.
Why Is the Charging Curve the Foundation of Tactics?
An electric car slows down not as its battery drains, but as it fills. The charging curve shows the relationship between the battery's state of charge (SoC) and the charging power (kW) received at that moment, and the power does not remain constant throughout the cycle. The reason lies in the charging method of lithium-ion cells: up to about 80 percent, charging proceeds in constant-current mode; when the cells reach a certain voltage, the system switches to constant-voltage mode and the power drops as a physical necessity. The battery management system (BMS) also actively limits the current to protect the cells from overheating, overcharging and premature wear.
The practical map of the curve is roughly as follows: the 0-10 percent range may be limited for protection purposes, the 10-60 percent range is generally the fastest section, power starts to drop between 60 and 80 percent, and above 80 percent charging slows down considerably to protect battery health. The last 10-20 percent slice can take as long as the first 40-50 percent. The entire answer to the "less often or more often" debate is hidden in this flattening part of the curve.
Peak Power vs. Average Power
Statements in manufacturer brochures such as "10 to 80 percent in 18 minutes on a 350 kW charger" are often misleading, because the vehicle draws its peak power only for a brief moment. For example, although the Ioniq 5 is advertised as 350 kW, it is limited to roughly 263 kW at peak, with an average of 205 kW in the 10-80 percent window. The average charging speed can vary between 40 and 90 percent of the maximum acceptance rate; this spread directly affects the choice of tactics.
| Vehicle | Max. acceptance rate | 10-80% average power | Ratio |
|---|---|---|---|
| Tesla Model 3 | 170 kW | 100 kW | 59% |
| BYD ATTO 3 | 89 kW | 73 kW | 82% |
| MG 4 | 142 kW | 116 kW | 82% |
| Porsche Taycan Plus | 320 kW | 230 kW | 72% |
| Ford Mustang Mach-E | 150 kW | 95 kW | 63% |
| Hyundai IONIQ 6 | 175 kW | 140 kW | 80% |
| Genesis GV60 Premium | 233 kW | 200 kW | 86% |
The ratio in the table carries the real message: in a vehicle with a low ratio like the Tesla Model 3, the curve drops noticeably, meaning leaving early brings a big gain. In a vehicle with a nearly flat curve like the Genesis GV60, with its 86 percent average, the time cost of waiting up to high percentages is much lower. The tactic is chosen according to the vehicle's curve character; there is no single answer for all vehicles.
Highlights
- The charging curve is fastest in the 10-60 percent range and slows down significantly above 80 percent.
- The average charging speed varies between 40-90 percent of peak power; it should be selected according to the tactic used.
- Frequent short stops usually reduce the total time and are more efficient than a few long charging sessions.
- For charging time calculations in winter and at busy stations, a 20-30 percent buffer should be added.
- Battery preconditioning speeds up DC fast charging; it should start 30 minutes in advance.
What Does the Fewer, Longer Charging Strategy Gain, and What Does It Lose?
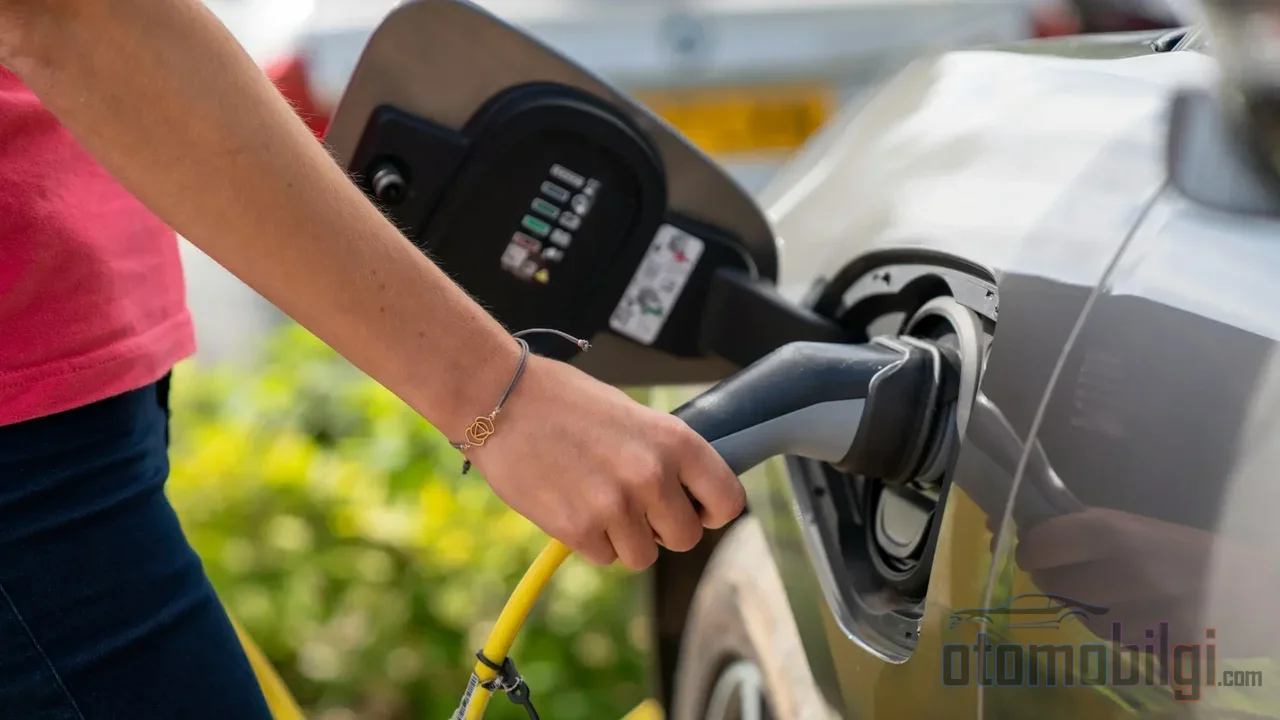
This is the strategy that seems intuitive at first glance: drain the battery as much as possible, then charge it at a station up to the high figures, keeping the number of stops to a minimum. The fixed costs per stop (exiting the station, connecting, accelerating) decrease and planning is simplified. However, this strategy has an invisible bill: the segment between 80 and 100 percent is the slowest part of the curve, and the final 20 percent can take as long as the first 40-50 percent. Also, since the battery starts from a higher SoC at each stop, the average power received drops.
This tactic only makes sense under a few conditions: if the vehicle's curve stays high in the upper segments too (a flat curve like the GV60), if you are on routes where charging stations are sparse, or if you are already planning a long meal break. Otherwise, every extra minute spent at the station comes not from your choice, but from the limits of battery chemistry.
The Frequent Short Charging Strategy: Staying in the Efficient Zone of the Curve
The second strategy suggests stopping more often, but staying only within the fast charging window each time. The practical approach recommended as a road tip is clear: driving with a more depleted battery and charging only up to about 60-70 percent at each stop is generally more time-efficient than waiting for 90-100 percent each time. Some sources define the window as up to 80 percent, and the most efficient range for DC fast charging as 20-60 percent; although window recommendations vary from vehicle to vehicle, their common denominator is the same: leaving the flat region of the curve early.
The secondary gains of this tactic are operational. After two to three hours of driving, most people already need a 20-30 minute break; matching charging stops with natural breaks such as meals, restrooms, or coffee makes charging time appear not as waiting, but as part of the plan. In terms of driver fatigue as well, frequent short breaks are safer than staying glued to the wheel through a single wave of tiredness. Among electric vehicle drivers' forums, there are those who still advocate low-stop plans on very long journeys exceeding 800 km; however, measured independent test data does not support that side, and practical experience mostly works in favor of frequent short stops.
Simple Calculation: Power Divided Into Energy
For a rough estimate of charging time, the practical formula is: energy to be added (kWh) divided by charging power (kW). For example, adding 40 kWh at 50 kW of power takes 48 minutes on paper. However, this calculation assumes constant power, ideal battery temperature, and no shared load. In the real world, cold weather, dynamic load management (a 200 kW connected station can share its power among four vehicles), and the vehicle's own limits disrupt the calculation. For this reason, especially in winter or at busy fast-charging stations, you need to add a 20-30 percent time buffer to the calculation.
Hidden Variables That Affect Charging Power
Even if the tactic is chosen correctly, instantaneous power can deviate from your plan due to three factors. Knowing these allows you to correct your decisions on the road.
Battery Temperature
The strongest effect on charging speed is battery temperature; the ideal performance range is approximately 20-25°C. In a cold battery, internal resistance increases and the BMS limits the current; at a 150 kW charger, power can briefly drop to 30-60 kW. Some manufacturers, like Tesla, heat the pack to around 50°C during fast charging for performance.
Preconditioning
Most modern electric vehicles bring the battery to the ideal temperature before arrival when a fast-charging station is set as the destination in the built-in navigation; for the best results, this preparation should begin about 30 minutes in advance. Driving alone or heating the cabin changes the battery temperature very little. Although preconditioning consumes energy, the minutes it saves at the start of DC fast charging more than compensate for this cost.
Architecture and Station Sharing
Vehicles with 400V architecture can be limited to about 180 kW even at a charger drawing up to 360 kW, due to pack voltage; 800V vehicles approach peak power at the same unit. On the AC side, the deciding factor is the onboard charger: a vehicle with an 11 kW internal charger connected to a 22 kW outlet can never exceed 11 kW.
Decision Tactic: Which Strategy Should You Choose on the Road?
The practical decision rule is shaped by three questions. If your vehicle's average power in the 10-80 window is close to its peak power (a ratio above 80 percent), reducing stops and charging to high levels is not costly. If the ratio is low, especially below 60 percent, frequent short stops win by a wide margin. The second question is the route: in regions where stations are sparse, you are forced to minimize stops as much as possible. The third is your need for breaks: if you take a natural break every two to three hours, the frequent short charging tactic comes almost free of charge.
The realities on the range side also frame this decision. Real-world range is on average about 16 percent below the WLTP catalog value, and consumption can exceed laboratory values by 1-20 percent; below 15°C, range can decrease by 20-25 percent. When planning, base your calculations not on the catalog range but on the real range adjusted for the season, and leave a margin in every stop plan.
Short and Clear Answer
In most electric vehicles, on most routes, the winning strategy is frequent short stops: keeping the battery at a low-to-medium charge level and charging it only up to 60-70 percent at each station is usually faster in total door-to-door time than fewer long charging sessions. The exceptions are vehicles with a flat curve that stays strong in the upper ranges, and routes where stations become sparse. Frequent breaks also reduce driver fatigue; that is a real gain of long-distance travel that no stopwatch measures.
In practice, treat your strategy not as a rigid plan but as a decision rule updated along the way: unplug at each stop when the curve starts to flatten (when the power display drops noticeably), run preconditioning if the battery is cold, and add a buffer in winter months to your calculated times. Driving an electric vehicle on long journeys is a proactive game, not a reactive one; when stops are chosen deliberately, range anxiety gives way to a sense of rhythm.
Sources
- What Your EV Charging Time Calculator Doesn't Tell You
- EV charging curve: Why charging speed fluctuates
- How Long Does it Take to Charge an Electric Vehicle (EV)?
- EV Charging Windows: Why 10-80% Matters
- Road Trip EV Charging: How to Plan Stops
- Range Anxiety, Solved: An EV Road-Trip Charging Strategy
- Simple Tips for Smooth EV Road Trips
- What Is EV Battery Pre-Conditioning
- EV range impact of speed and temperature