Why Charging Above 80% on Fast Charging Isn't Worth the Wait?
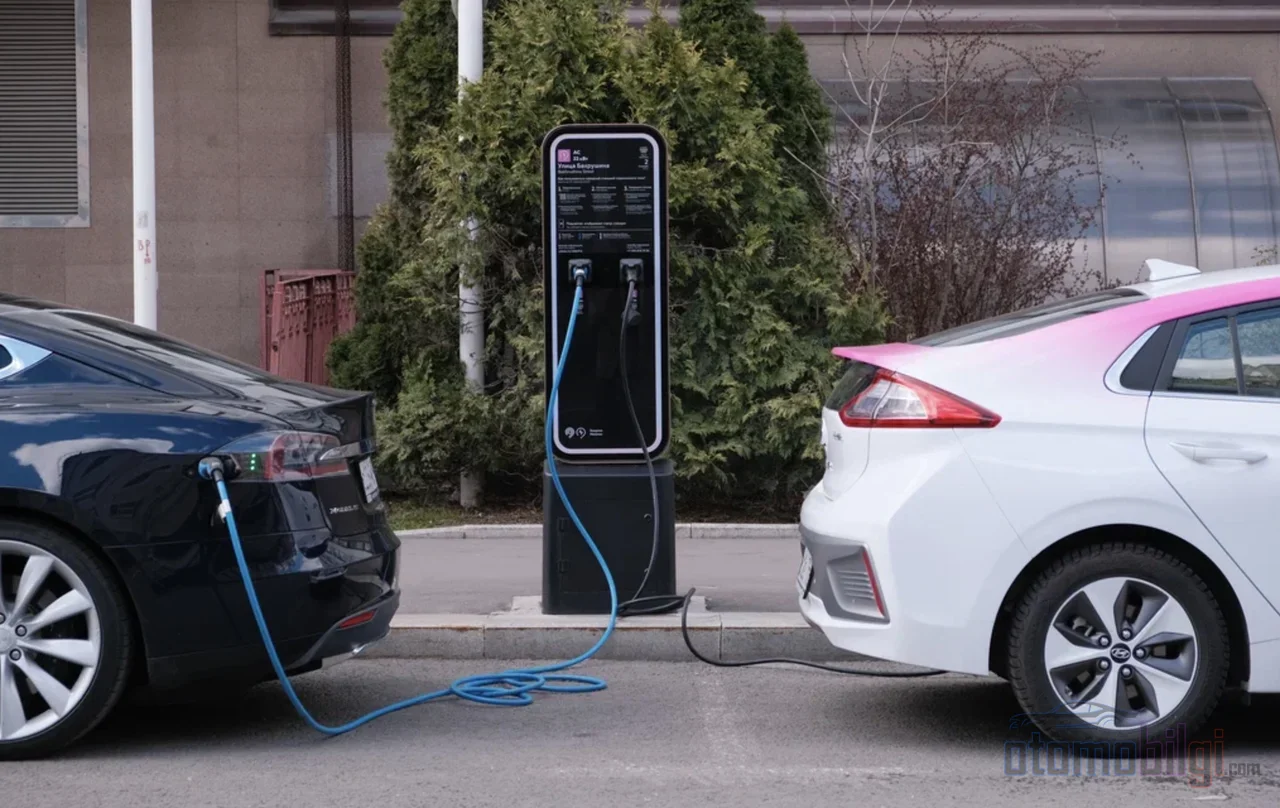
Share This Page
In DC fast charging, the battery rapidly charges up to 80%, after which the charging power gradually decreases; waiting for the last 20% on a long journey is generally not worth it, because it wastes a disproportionate amount of time relative to the range it adds. Leaving the charging station and continuing on your way gains noticeably more kilometers in the same amount of time. This article explains why the charging curve bends using simple figures and shows practical ways to shorten your journey time.
Highlights
- The last 10-20% can take as long as the first 40-50%.
- Charging times are generally given for the 10-80% band; after that, charging is deliberately slowed down.
- The average charging power stays between 40-90% of the vehicle's peak value.
- On long journeys, charging to 60-70% and leaving early is generally faster than waiting for 90-100%.
- A cold battery tapers much earlier and more sharply, well before 80%.
Why does fast charging slow down after 80%?
The short answer: the battery itself wants this. Lithium-ion cells CC-CV are charged with a constant current - constant voltage profile, meaning constant current and constant voltage. When the battery is empty or half full, high current is accepted without issue; the power curve runs flat and high. However, as the cells fill up, placing lithium ions inside the electrode structure becomes increasingly difficult, and the cell voltage approaches its upper limit. At this point, the battery management system, i.e. the BMS, reduces the current in order to keep the voltage within a safe band and keep heat under control. This is exactly what the gradual drop in the power value - tapering - is.
The physical background is simple: pushing electricity into a nearly full cell is much harder than pushing it into an empty one. If you force the current, heat increases and unwanted chemical and mechanical changes can be triggered inside the cell, which shortens the cycle life. In other words, the slowdown after 80% is not a malfunction, but a behavior designed to protect the battery.
The typical course of the charging curve can be summarized in four stages:
- At low state of charge, power is accepted at a relatively high level.
- High power continues in the middle band (around 20-60%); this is the most efficient zone.
- At around 70-80%, many vehicles begin to noticeably reduce power.
- Between 90-100%, charging slows down dramatically; adding a single percentage point at around 95% can take much longer than adding one at around 60%.
That is why the charging times announced by manufacturers are almost always given for the 10-80% band. The kW value written on the charger is also the maximum capacity; it is not a guarantee of the power that will be delivered throughout the entire session.
The time inequality in figures: what does the last 20% cost you?
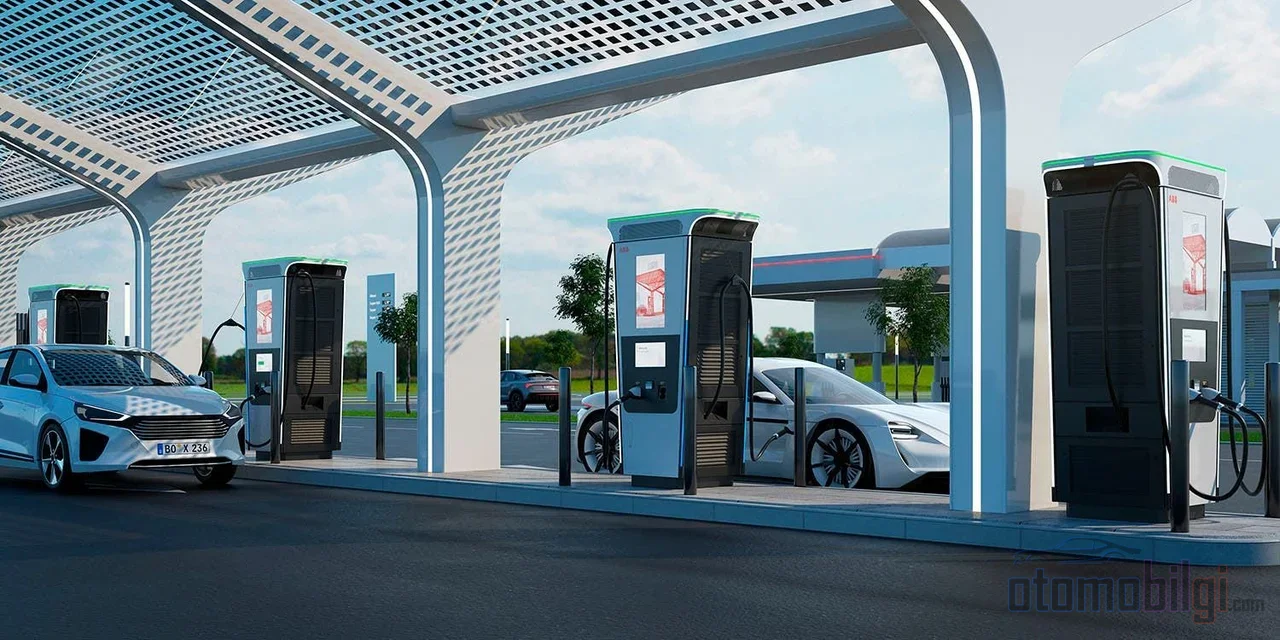
From an engineering standpoint, the question is about range gained per minute. The last 10-20% segment can take as long as the first 40-50%. A concrete scale: 40 kWh with a battery-powered vehicle, going from 20% to 80% on a 50 kW DC unit typically takes 30-40 minutes. When you need to stay at the station for the final 20% of the same session, the range added per minute drops noticeably. Waiting 20-30 minutes for the last few percentage points is always a slower solution than setting off early and continuing to drive.
Another critical detail is the difference between peak power and average power. The average charging power varies between 40-90% of the vehicle's maximum acceptance rate. Let's look at a sample table:
| Model | Average power (10-80%) | Peak power | Ratio to peak |
|---|---|---|---|
| Hyundai IONIQ 6 | 140 kW | 175 kW | 80% |
| Genesis GV60 | 200 kW | 233 kW | 86% |
| Porsche Taycan Plus | 230 kW | 320 kW | 72% |
| Tesla Model 3 | 100 kW | 170 kW | 59% |
| Ford Mustang Mach-E | 95 kW | 150 kW | 63% |
The lesson from the table is this: The advertised peak value never lasts through the entire session. For example, a model may state 10-80% in 18 minutes on a 350 kW unit, yet in practice it charges with an average well below the peak power. You should plan based on the 10-80 average, not the peak value.
Frequent and short, or rare and long?
There are two schools of thought in long-distance strategy, and the numbers clearly point to one of them. Rather than waiting up to 90-100% at every stop, running the battery lower and charging only to 60-70%- even if it increases the number of stops - generally shortens the total journey time. Because you keep each session in the most efficient flat section of the charging curve; you don't spend time in the taper zone.
Example comparison: two strategies, one question
Imagine two drivers traveling the same route. The first waits for 100% at every station: fewer stops, but sits an extra 20-30 minutes in the taper zone at each stop. The second stops when the battery drops to 50-60%, charges to 70-80%, and continues on the road: takes breaks more often but keeps each break short. The total station time for the second driver is clearly shorter. Moreover, practical driving recommendations already aim for a break every 2-3 hours or every 180-250 km; in other words, stopping frequently is also better suited to the journey's rhythm.
This strategy also has a system side: drivers waiting for 100% cause queues to form at busy stations and reduce throughput. Operators therefore encourage charging to 80% and may apply idle fees to vehicles that remain plugged in after charging is complete. Sticking to the rule of stopping around 80% saves time both for you and for the driver waiting after you.
Hidden factors that reduce charging speed
Two vehicles can show completely different curves at the same station. Independent of tapering itself, there are variables that determine performance:
- Battery temperature: The ideal value is around 20-25°C. A cold battery tapers earlier and more aggressively; below +10°C, a unit rated at 150 kW may initially show only 30-60 kW.
- Preconditioning: It is not possible to pre-prepare the battery via driving or cabin climate control. When you enter the charging station into the navigation, most new models pre-condition the battery about 30 minutes before arrival; a battery arriving without this feature used charges far below the power shown on the sign.
- Voltage architecture: A unit supporting up to 360 kW can deliver about 180 kW to a 400V-architecture vehicle. An 800V architecture draws much more power from the same unit.
- Load sharing: When multiple vehicles are connected at the same location, power can be shared; a unit showing red on its display may fill you slower than you expected.
Practical takeaway: Route planning tools produce idealized scenarios. In real route planning, add a 20-30% time buffer and know your vehicle's own charging curve; two neighboring vehicles on the same unit can take very different times to charge.
Charging on long roads in Türkiye: a practical framework
Türkiye has reached the point where its infrastructure can support long-distance travel: as of the first quarter of 2026, there are roughly 400 thousand electric vehicles and more than 40,000 charging sockets on the roads. Fast charging stations are available along the main corridors; on the Istanbul-Ankara route, the average charging cost is in the 600-900 TL range, offering clear savings compared to its gasoline equivalent. The per-100-km cost of public DC charging is also below that of gasoline.
In practice, three habits are enough: Set your route with mobile route planning tools, enter the station into the navigation to trigger battery pre-heating, and aim for the 80% band at every stop. Even long-range popular models - Togg T10X, Hyundai IONIQ 6, Tesla Model Y - are not exempt from this rule; no matter how long the range, the cost of the last 20% works on the same logic.
There is also a regulatory side: With a regulation that entered into force in 2026, charging on DC units in Türkiye can be automatically terminated when the battery reaches 85%, provided that prior notice is given. In other words, waiting beyond 80% is no longer just inefficient - it is also limited by the system.
Does it harm the battery? How strict is the 80% rule?
Fast charging itself does not treat the battery differently depending on whether you stop at 80% or 100%; the real risk is leaving the vehicle fully charged at 100% for a long time. NMC chemistry batteries age noticeably faster when left continuously full in hot climates. The slowdown after 80% is precisely part of this protection logic: high current generates heat, and heat is the main enemy of cell life. Although degradation is still debated in the literature - some large-scale vehicle data consider high-power DC charging a major risk factor while some real-world studies find no measurable difference - the focus of the debate is less on charging speed and more on temperature and state of charge.
The 80% figure is not a strict rule, but a common guideline. The limits vary depending on cell chemistry and the vehicle; for your own car, follow the charging limits recommended by the manufacturer. Summarizing general practice: occasional 100% on AC charging in the city is fine, the 80% band on DC fast charging on long trips, and the manufacturer's recommended limit is the healthiest framework for daily use.
Conclusion: Minimize time spent at the station
The charging curve bends because the battery physically cannot accept the last 20% quickly. In long-trip planning, the right question is not up to what percentage to fill the battery, but how many kilometers per minute you are gaining. The answer to that question is consistent: leave at around 80%, arrive with the battery pre-warmed, and proceed with frequent but short breaks. Every unnecessary minute you spend at the station is subtracted from the road, which is your real goal.
Sources
- Charging Tapering: What You Need to Know
- How Long Does it Take to Charge an Electric Vehicle (EV)?
- Why Your EV Charges So Fast-Then Suddenly Slows Down
- What Your EV Charging Time Calculator Doesn't Tell You
- What is DC Fast Charging
- How to Reduce Electric Vehicle Charging Time
- Ways to Shorten Electric Vehicle Charging Time
- Long-Distance Driving with an Electric Vehicle: Route Planning Guide
- Electric Vehicle Charging Cost and Consumption Between Istanbul and Ankara
- Electric Vehicle Models with the Longest Range
- The Ultimate Guide to EV Road Trip Planning
- EV Battery Health: Key Findings from 22700 Vehicles
- Impact of Charging Rates on EV Battery Life (Bhagavathy et al., 2021)
- Why does electric vehicle charging slow down after 80%?
- 2026 Türkiye EV Charging Guide