Charging Loss: How Does Electricity Vanish From the Wall to the Battery?

Share This Page
The kilowatt-hours you feed your car from the outlet are shown by the meter, while the amount actually entering the battery is reported by the vehicle. These two numbers will never match. On the way from the wall to the battery, the AC charging unit, DC conversion, cable resistance, cooling and battery management each take their own share; overall charging efficiency typically runs in the 80-95% range, meaning that 5-20% of the electricity you draw never reaches the tank. This article explains at which stage, why, and how much of these losses occur, with concrete figures.
What exactly does charging loss mean?
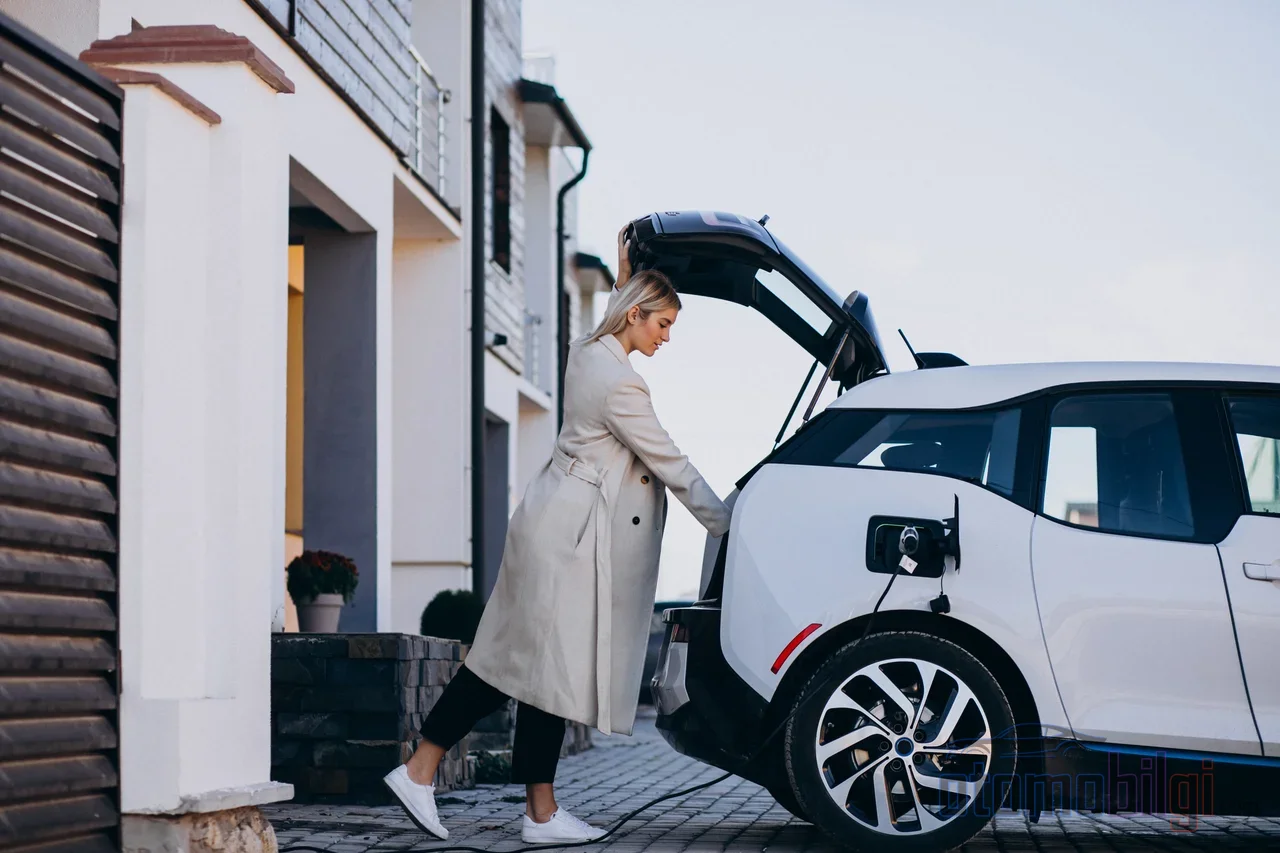
Charging efficiency is the ratio of the energy drawn from the grid to the energy stored in the battery. For example, if 20 kWh passed through the charging meter and only 18 kWh was actually added to the battery, the difference is 2 kWh - a loss of 10%. Although this definition seems simple, where the measurement is taken changes the result completely: The same session can yield three different measurements. The home meter records grid energy, the charging point records delivered energy, and the vehicle records energy added to the battery. These three measure different boundaries, and not all of the difference between them is loss; part of it simply results from the measurement boundary changing.
It is generally accepted that charging losses in an electric vehicle fall in the 10-25% range. Another practical approach is to look at the battery size: Most vehicles draw about 10-15% more energy than their capacity to fill an empty battery. Charging a 100 kWh battery can demand roughly 110-115 kWh from the socket. This figure is not an industrial defect, but the inevitable sum of physics and auxiliary systems.
Key Takeaways
- Electric vehicle charging losses generally fall in the 10-25% range.
- Loss measured on a 2.3 kW household outlet: 12.7-24.2%; on an 11 kW wallbox: 5.1-7.0%.
- In AC charging, the onboard charging unit typically accounts for 10-15% of total losses.
- DC fast charging efficiency: 85-90%; heating and cooling consume additional energy.
- Charging from empty draws about 10-15% more energy than the battery size.
At which points between the wall and the battery do losses occur?
AC charging: The price of the conversion inside the car
In home AC charging, it is the vehicle itself that converts the alternating current from the outlet into the direct current needed by the battery; this is called the onboard charger (OBC). Since conversion is never loss-free, this unit alone typically accounts for 10-15% of total losses. High-quality components and liquid-cooled units can bring this figure down to the 5-8% range. The cable also takes its share: A typical Level 2 cable has a resistance of 0.1-0.3 Ω; at 32 A of current, this means a continuous heat loss of 100-300 W in the cable according to the heat rule.
The second major item is the battery management system and auxiliary systems. Cell balancing, temperature monitoring, contactors and communication units are active throughout the charging session and consume 2-5% of the energy. Since this consumption is fixed, its share of the total energy grows as the session gets longer.
DC fast charging: Losses don't disappear, they only change location
In DC fast charging, the conversion is the station's job, not the vehicle's; therefore the onboard charger is bypassed. However, the loss doesn't vanish, it is simply moved to the station. DC fast charging efficiency is in the 85–90% range; in Level 2 AC charging this figure rises to 90–95%. Stations operating in the 50–350 kW range generate serious heat in the battery and equipment, and the cooling systems activated to control that heat are also fed from the charging energy. Result: DC fast charging has an apparent speed advantage, but its cost per kilowatt-hour is higher than AC charging due to both thermal losses and unit price.
Why does a low-power home outlet cost more?
Charging with a standard 220 V home outlet is technically possible, but the efficiency math doesn't work in your favor. A systematic test conducted on five vehicles, keeping the battery temperature at 20–30°C and within a 10–90% charge range, clearly demonstrated the relationship between power and loss: At the home outlet drawing about 2.3 kW, the loss was measured between 12.7–24.2%, while on the 11 kW wallbox the loss dropped to 5.1–7.0% for all the same vehicles. The lowest loss in every vehicle was at 11/22 kW, and the highest loss was at the 2.3 kW outlet. The worst result among the tested vehicles was recorded by the Mercedes-Benz CLA with a 2.3 kW mobile charger: a loss of 24.2%. The Tesla Model Y delivered the best performance in the same conditions with a loss of 12.7%.
The mechanism is simple: Auxiliary systems (BMS, safety, communication) draw a similar baseline power no matter how low a current you charge with. In a session that lasts all night at 2.3 kW, this fixed consumption grows disproportionately relative to the energy transferred. Therefore, a caveat is needed to be able to say that lower power is always more lossy: The result depends on the operating point of the vehicle's onboard charger, the session duration, and the temperature; it is not a universal rule. Nevertheless, the practical conclusion doesn't change - transferring the same energy at higher power in a shorter time is generally more efficient.
| Charging method | Measured loss | Note |
|---|---|---|
| Home outlet (~2.3 kW) | 12.7–24.2% | Highest loss in all tested vehicles |
| 11 kW wallbox | 5.1–7.0% | Lowest loss in all vehicles |
| Level 2 AC (general) | 90–95% efficiency | Conversion is done by the onboard charger |
| DC fast charging | 85–90% efficiency | Conversion at the station, cooling consumes energy |
How does temperature affect charging loss?
Lithium-ion batteries operate most efficiently in the 20–25°C range. When the temperature drops below 0°C, the cells' internal resistance increases, and pre-heating the battery before charging can consume 20–30% extra electricity. Above 35°C, the opposite problem begins: cooling kicks in and takes a share of the charging energy; in very hot climates, the cooling load is known to add an extra 10–20% to charging. In extremely cold regions, users report a 30-50% drop in effective charging efficiency; since these reports depend on conditions, the upper bound should not be read as an exact figure.
In winter, the picture is not limited to charging losses either: The range of electric vehicles shortens by an average of 10-25% in cold weather; around 0°C the loss can reach 20-25%, and at -7°C up to 30-40%. On short trips that start completely cold, the loss grows even larger; because the vehicle has to heat both the battery and the cabin against the cold. Cold weather also lengthens charging times, because a battery with increased internal resistance wants to warm up before accepting high current.
Why does real consumption come closer to what you read from the plug than to WLTP?
The WLTP cycle is measured under controlled laboratory conditions, at a specific temperature, in a scenario where auxiliary loads are largely restricted. In real use, air conditioning, heating, speed profile and thermal management come into play; which is why real range usually stays 10-30% below the WLTP value. The kilowatt-hours you measure from the plug, on the other hand, measure something entirely different: The energy drawn from the grid already contains all the losses in the charging chain. So the meter bills you not only the net energy in the battery, but everything spent from the wall to the battery. For daily budget calculations, the most reliable indicator is therefore not the WLTP range figure, but the measurement you read from the plug.
How do you measure your own charging loss?
To measure your loss correctly, a single rule is enough: Divide the energy increase in the battery by the energy drawn from the grid in the same session. Use one single consistent measurement point for this; ideally a meter dedicated to charging. A general household meter is not sufficient on its own, since it will also count the washing machine and the water heater. Instead of the battery percentage, rely on the vehicle's charging report in kWh, if available; a percentage indicator does not measure energy, it is an estimate.
- Make a dedicated charging meter or the kWh record of a wallbox your reference point.
- Note the amount of energy in the battery (in kWh, from the vehicle report) at the start and end of the session.
- Divide the difference by the grid input; you get the loss as a percentage.
- Compare multiple similar sessions with a similar charge range and temperature.
No diagnosis can be made from a single session. For example, there are vehicle owners who panic upon seeing a 20% loss in the battery; but such high values are often caused by the measurement limit coming into play or by a one-time anomaly. The same care is needed when carrying published loss figures over to your own vehicle: Comparisons made without specifying the tested vehicle, charging power, temperature, charge range and measurement point are not reliable.
Practical ways to reduce losses
Moving from low power to medium power is the single most effective move: Switching from level 1 to level 2 (240 V) can improve efficiency by 5-10%. Charging at 70-80% of maximum power additionally yields 3-5% efficiency gains. The charging range is also part of the equation: staying within the 20-80% band is more efficient than charging from 0 to 100; the final 20% takes disproportionately long and generates more heat.
Thermal strategy is the silent hero of loss reduction. Charging in the garage keeps the battery 5-10°C warmer than charging outside in winter and can improve efficiency by 10-15% in extreme weather. After a long drive, the battery is already warm; plugging in immediately reduces the energy that would otherwise be spent on thermal preparation. Preconditioning the cabin and battery during charging, i.e. drawing from the grid when needed, also preserves battery energy. Finally, don't neglect the equipment: check cables and connectors monthly, use short and clean cables, and make sure the installation uses copper conductors of appropriate gauge.
Practical recommendations based on home types in Türkiye
In Türkiye, charging from a standard 220 V outlet is possible anywhere, but the loss figures above show that a wall-mounted charging unit should be adopted whenever possible. Residential AC wallboxes are usually offered in 7.4 / 11 / 22 kW options; 7.4 kW is generally considered sufficient for the everyday user. For those living in apartment buildings, installation requires a legal process; RFID-card systems with per-user metering in shared parking lots are the common solution, and a separate meter is also the easiest way to measure charging losses accurately. For those living in detached houses, a wallbox installation provides both the lowest losses and the cleanest measurement point at the same time.
Conclusion: What the numbers actually say
Charging loss is not a sign of malfunction; it is the physical cost of every link in the chain. In AC charging, conversion and auxiliary systems take their share; in DC charging, station conversion and cooling; and under all conditions, cable resistance and thermal management; in total, 10-25% of the energy you draw never reaches the battery. That's why the kilowatt-hours you see on your bill reflect real-life consumption, not the WLTP label. If you want to measure your own numbers, a dedicated meter, a kWh-based vehicle report, and a few comparable sessions are enough - an owner who knows the numbers manages both their wallet and their range better.
Sources
- EV Charging Losses Explained: Where the Energy Goes
- EV Charging Energy Loss Explained & Reduced
- EV Charging Efficiency: Losses, Costs and How to Measure It
- Charging Efficiency Explained: A Complete Guide
- Home EV Charging Has A Hidden Cost
- Experimental validation of onboard electric vehicle smart charging losses
- How to Choose a Home EV Charger
- EV Charging in an Apartment Building
- Why Does EV Range Drop in Winter?