F1 Pre-Season Testing: Behind the Scenes of Data Collection
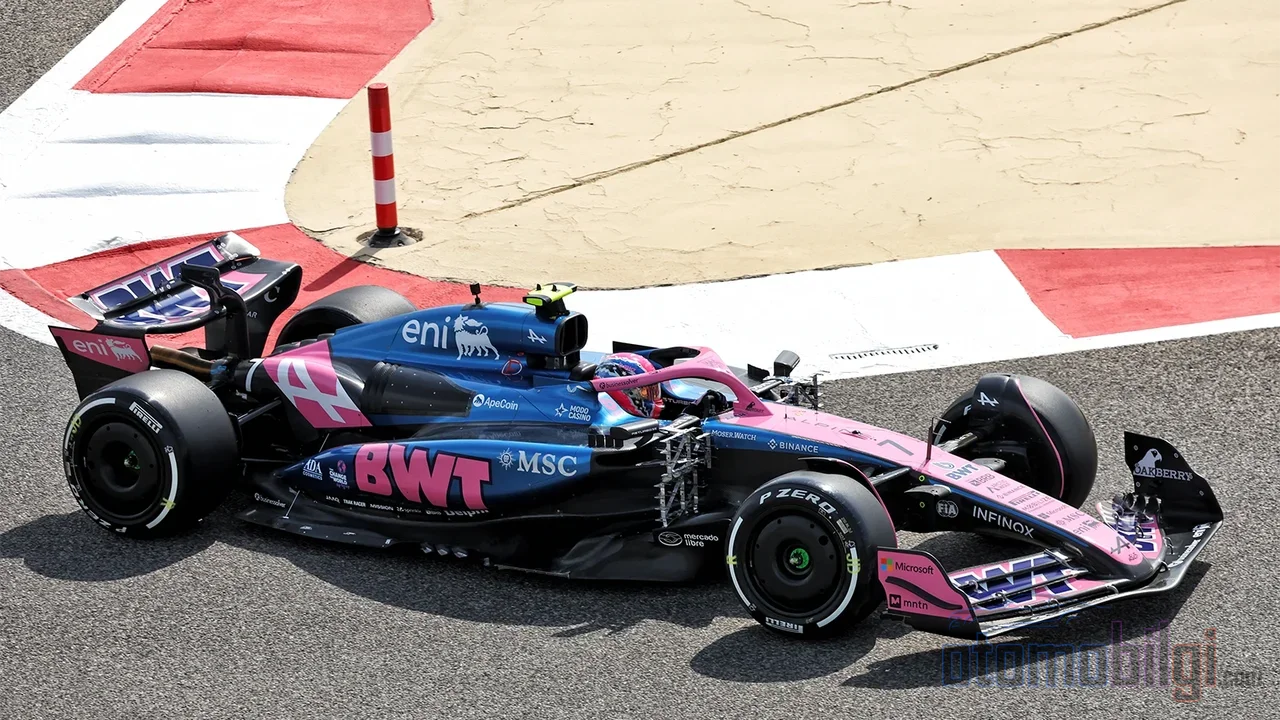
In February you see a name at the top of the timing sheets in Bahrain, everyone in the grandstands takes it for granted that team will be champion, and then in March everything turns upside down. This is a game played over and over every year in Formula 1, and the name of this game is pre-season testing. So what do these tests actually measure, what do teams hide there, and how much can we trust that timing sheet? We talked about the in-season testing ban and simulator work on the site before; now it is time to go behind the scenes of the official winter tests.
The 2026 season is a special year in this respect, because F1 went through a winter in which it was given twice the usual number of test days following a major regulation change. Two separate Bahrain tests, a Barcelona shakedown and private tests... In other words, the teams entered the season with far more track time than they have had for years. Yet making a season prediction has never been harder. Why? Let us take a look step by step.
How Do Pre-Season Tests Work?
In a classic year, teams run a single three-day test. In 2026, however, the program doubled: two separate tests were held at the Bahrain International Circuit on February 11-13 and February 18-20. The 2026 cars came with a completely new aerodynamic concept, a structure less dependent on active aero and ground effect, and a lighter, more agile design; with the rules changing this much, the governing body also granted the teams twice the usual number of test days, six official days in total. In addition, a three-day shakedown was held in Barcelona, and all this combined meant pre-season track time reached roughly three times that of normal years.
A test day starts at 10:00 local time, with a one-hour break between 14:00 and 15:00, and ends at 19:00; in other words, two four-hour sessions. The critical rule is this: each team can run only one car at a time. The roughly 24 hours of track time per event is shared between two drivers; this leaves about 12 hours per driver. That is why drivers usually split the day between them, one taking the wheel in the morning and the other in the afternoon.
Highlights
- In 2026, two official tests were held (February 11-13 and 18-20, Bahrain); twice the usual number of days
- Each team runs with a single car; about 12 hours of track time falls to each driver
- A race car carries around 300 sensors; in test cars this number is much higher
- 10 kg of extra weight adds about three tenths of a second to lap time
- Test timing sheet results should be read with a pinch of salt
What Happens on a Test Day?
A test day flows with a much more repetitive rhythm than a race weekend. The car constantly goes in and out of the garage; at every stop, system checks are carried out, and setup trials are repeated with different fuel levels and tire compounds. The mechanics practice pit stops, while the engineers compare the incoming data with simulation and wind tunnel findings. That famous timing sheet that emerges at the end of the day is, in fact, only the visible tip of this intense work.
What Is Really Being Measured in Testing: Data and Correlation
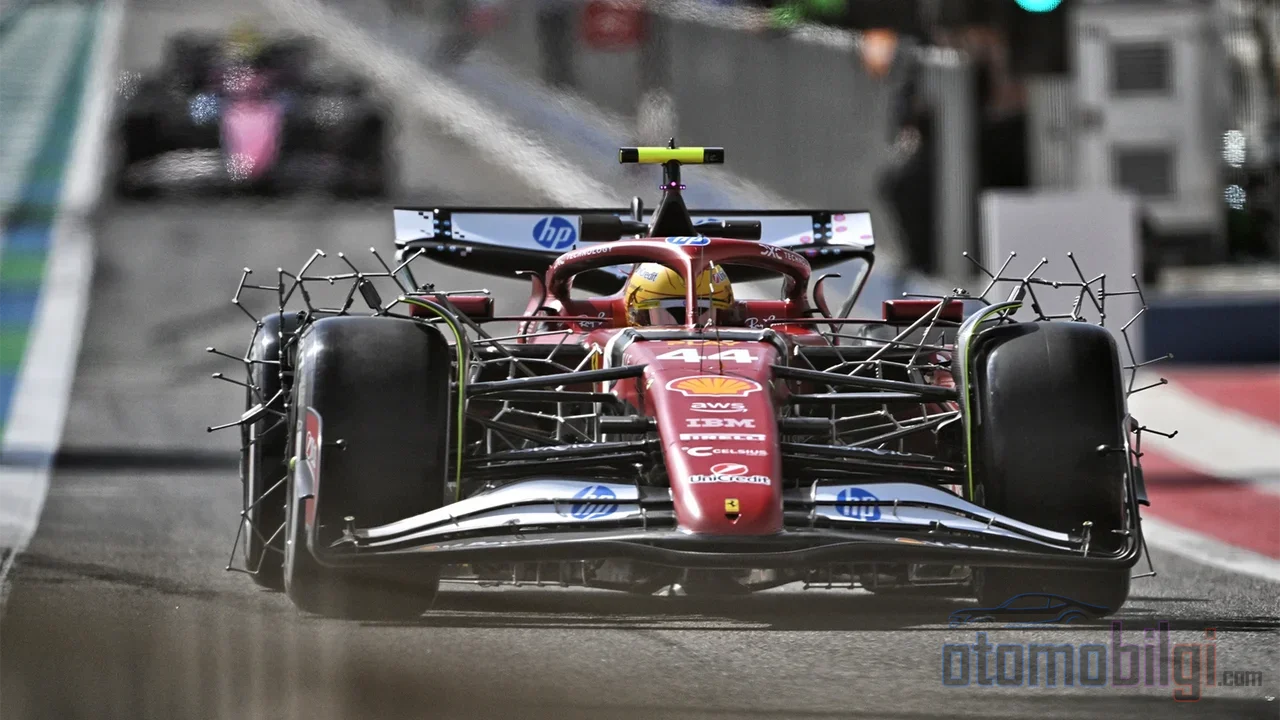
Here is the point that most viewers miss: the real goal in testing is not setting fast laps, but collecting the right data. The main objectives are; finding performance, surfacing problems early, improving reliability, and perhaps most importantly, checking whether simulator data overlaps with real track data, in other words, correlation. A race car carries around 300 sensors; on test cars that number rises much higher. In a regulation year like 2026, when all simulation models turn partly into guesswork, this validation work was more critical than ever.
What Is an Aero Rake?
You have probably noticed those strange scaffolding-like structures attached to the front or rear of cars in test photos. They are called an aero rake. These structures, carrying multiple Kiel probes, measure the pressure of the air passing over the car; the probes can capture flows coming from different angles within a 60-degree range. Large rakes are used especially to examine the airflow around the front tires, and while they are not allowed on race weekends, they are free in testing. In other words, those ugly scaffolds are measuring instruments that show whether the car gives the same numbers between the wind tunnel and computer models and the real track.
What Is Flow-vis Paint For?
The other classic sight is cars covered in fluorescent paint patterns. This mixture, called flow-vis, consists of fluorescent paint powder and paraffin oil; it dries as the car speeds up and leaves fine, detailed patterns on the bodywork. Engineers read from these patterns how the air flows over the body. Rakes and flow-vis together are the most important tools for verifying whether the airflow map from simulation matches the real world.
Sandbagging: The Art of Hiding Speed
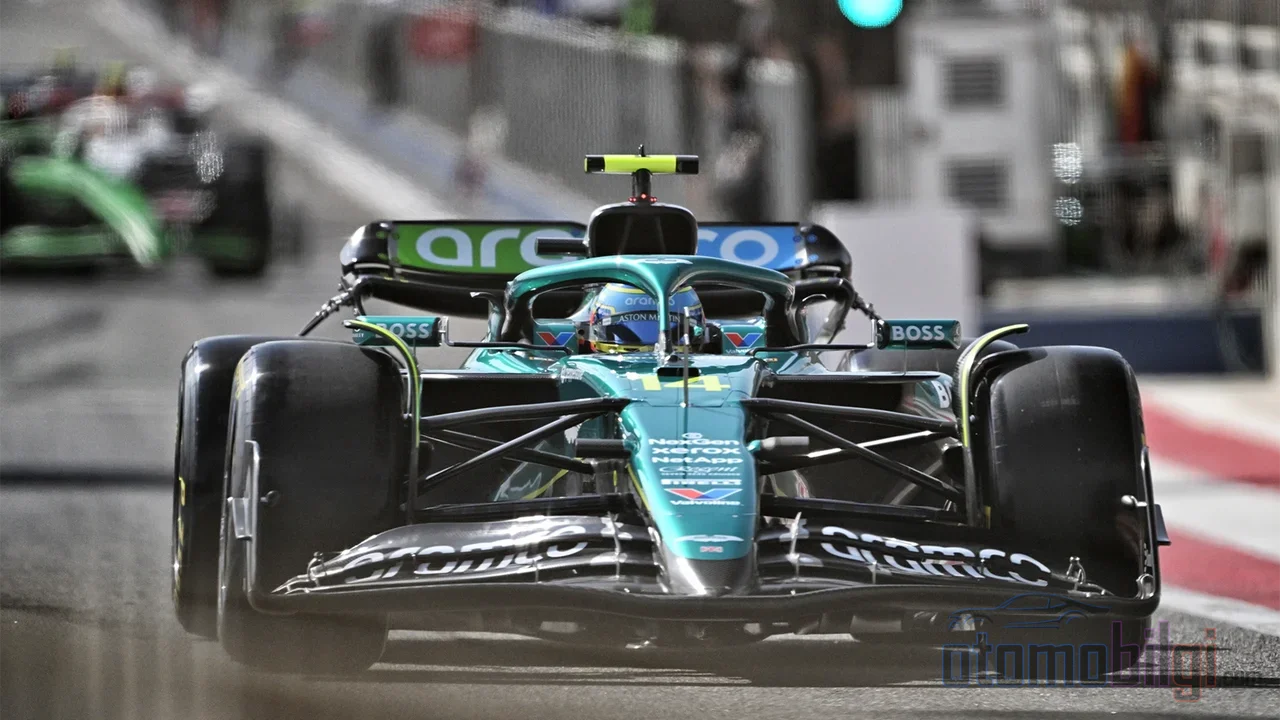
The most talked-about side of testing, though, is the secrecy aspect. Sandbagging means deliberately not showing the car's true lap time potential. Why? If you show your rivals your real speed, they develop by targeting you; also, emerging from an unexpected position in the order provides a psychological advantage. The tricks they use for this are quite practical: filling the tank with a heavy fuel load, adding extra weight, i.e. ballast, to the car, using a weak fuel mixture in the engine, opting for the slowest, i.e. hard, tire compounds, or the driver lifting off the throttle at certain points of the track. The language of numbers is striking too: a car can be 10 kg overweight in testing, and this weight is usually not removed until the final day; 10 kg means roughly three tenths of a second per lap. Three tenths of a second means several positions in qualifying.
The opposite trick also exists: the glory run, that is, setting the car up as light and fast as possible to capture an unrealistic lap time. It is rarely seen nowadays, but it still happens to please sponsors or lift morale in the garage. So neither the name at the top of the timesheet nor the name at the bottom always tells the real story.
Why Is the Timesheet Misleading?
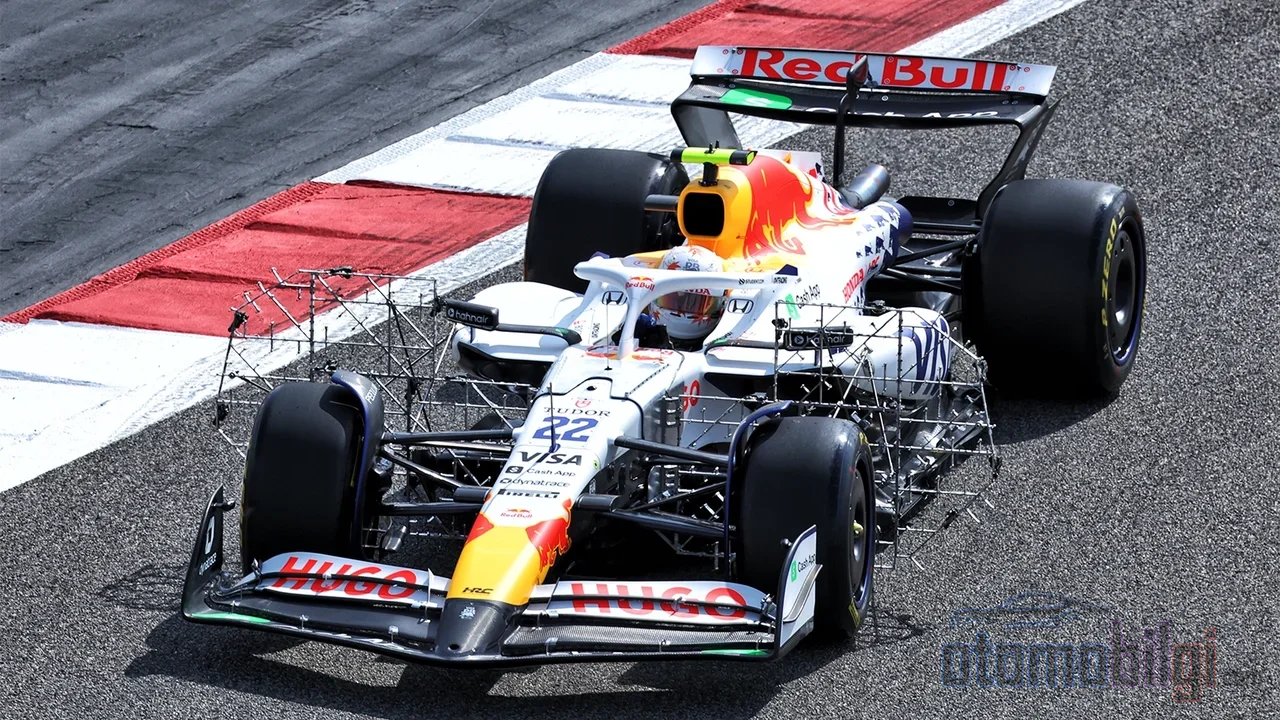
So how should we read the timesheet in our hands? Short answer: with a pinch of salt. At least five variables affect the fastest laps: fuel load, tire compound, car weight, engine mode, and the time of day. Moreover, teams almost never reveal how much fuel they used in a session; cars equipped with sensors and rakes may also behave differently from their normal setup. So when you put the lap times of two teams side by side, you are actually trying to solve an equation with five unknowns.
The teams themselves are solving this equation too, and with surprising accuracy. Thanks to GPS tracking, rivals' speed and acceleration data can be monitored; from this, engine power and available engine modes can be calculated. A car's acceleration and braking profile gives the most useful clues for estimating engine mode and fuel load. So while you sit at home staring at the timesheet, the engineers in the garages are deciphering each other's acceleration curves.
The Most Reliable Compass: Long Runs
So is there no reliable yardstick at all? There is: long runs. For example, in Barcelona it is known that a team running 66 laps from a single starting point begins with roughly 100 kg of fuel and finishes near zero; the lap times from such a run can be compared with your own long runs. Comparing low-fuel single laps is nearly impossible because fuel loads and engine modes are unknown. One more calculation clarifies the effect of weight: in older cars, adding 100 kg of fuel added 16 percent to the total weight; in today's 745 kg cars this ratio is lower, but the variable is still in play. Yet the tests are now so short that teams cannot even spare time to try a full race distance; getting a good reading from the cars has become harder over the years.
What Did the 2026 Tests Tell Us, and What Did They Hide?
2026 became a laboratory where all these dynamics were seen in the field. On the opening day of the first test in Bahrain, Lando Norris finished ahead of Max Verstappen; on the third day, the Mercedes duo of Kimi Antonelli and George Russell were the two fastest names. Red Bull completed 343 laps in the first test, and Verstappen set the team's fastest lap at 1:34.798; across both tests, 672 laps over six days, that is 3,636 km. Still, expert assessments were that the focus on sandbagging was exaggerated, but that Mercedes held a significant speed reserve in reserve. Even a former champion openly stated that those making predictions based on test speeds are wrong almost every year, that unexpected teams can look genuinely fast in winter testing, and that viewers should not go by lap times.
Another interesting measurement of 2026 was in the spread of the grid: the gap between pole position and the slowest car in qualifying was 5.54 percent of the lap time, the widest range of the last six seasons. In 2025, that ratio was only 2.49 percent. So when the rules changed without limit, everyone had to do a bit of guesswork, and the grid opened up. Also, there were two weeks between the final test and the season opener, the Australian Grand Prix on March 6-8; that window is enough time for teams to almost certainly fit new parts to their cars. So the car you saw at the test may not be the car that takes to the track in Melbourne. As for the number of laps: although racking up kilometers matters, there is no guarantee that the team logging the most laps will be the most successful of the season.
Why Is Testing So Restricted?
So if data is so valuable, why is on-track testing limited to just a few days a year? The short answer: money. Unlimited testing would turn into a spending race that only the richest teams could win; that is why in-season testing was banned in 2009 and the testing quota was reduced to 15,000 km. Today's asymmetry is striking: simulator time is unlimited, while on-track testing is limited to a few hours per year. This balance has shaped how modern F1 teams are organized from top to bottom. The single practice session on sprint weekends and early park ferme are also among the factors that make simulation validation harder.
The bottom line: Why Is It Hard to Predict the Season from Test Results?
Here is the clear answer to the question at the start: pre-season testing is not a championship standings, but a data-gathering and validation exercise. Teams are not trying to look fast there; they are trying to match their simulators to the track, find the car's problems, and hide their hidden trump cards. Fuel loads are not disclosed, tire compounds and engine modes are unknown, sandbagging is always on the table, and cars pick up upgrades before the first race. Therefore, the test timesheet alone is never enough to make a season prediction; the most solid reading comes from combining long runs, GPS analysis, and the reliability picture. Next February, when you look at the timesheet and pass judgment, keep in mind: those numbers tell you who showed the least, not who was the fastest.
Sources
- The beginner's guide to F1 pre-season testing
- A beginner's guide to pre-season testing
- Why F1 Teams Barely Get to Test, and What They Do Instead
- What happens in F1 pre-season testing and why is it important?
- Essential Guide: How to read Bahrain pre-season testing
- What is an F1 aero rake?
- 11 things we learned from F1 2026 pre-season testing
- Gary Anderson's guide to deciphering F1 testing fuel loads
- F1 pre-season testing 2026: Fastest times, most laps
- 2026 Bahrain Pre Season Testing