Telemetry on Track: How to Go Faster with Data?
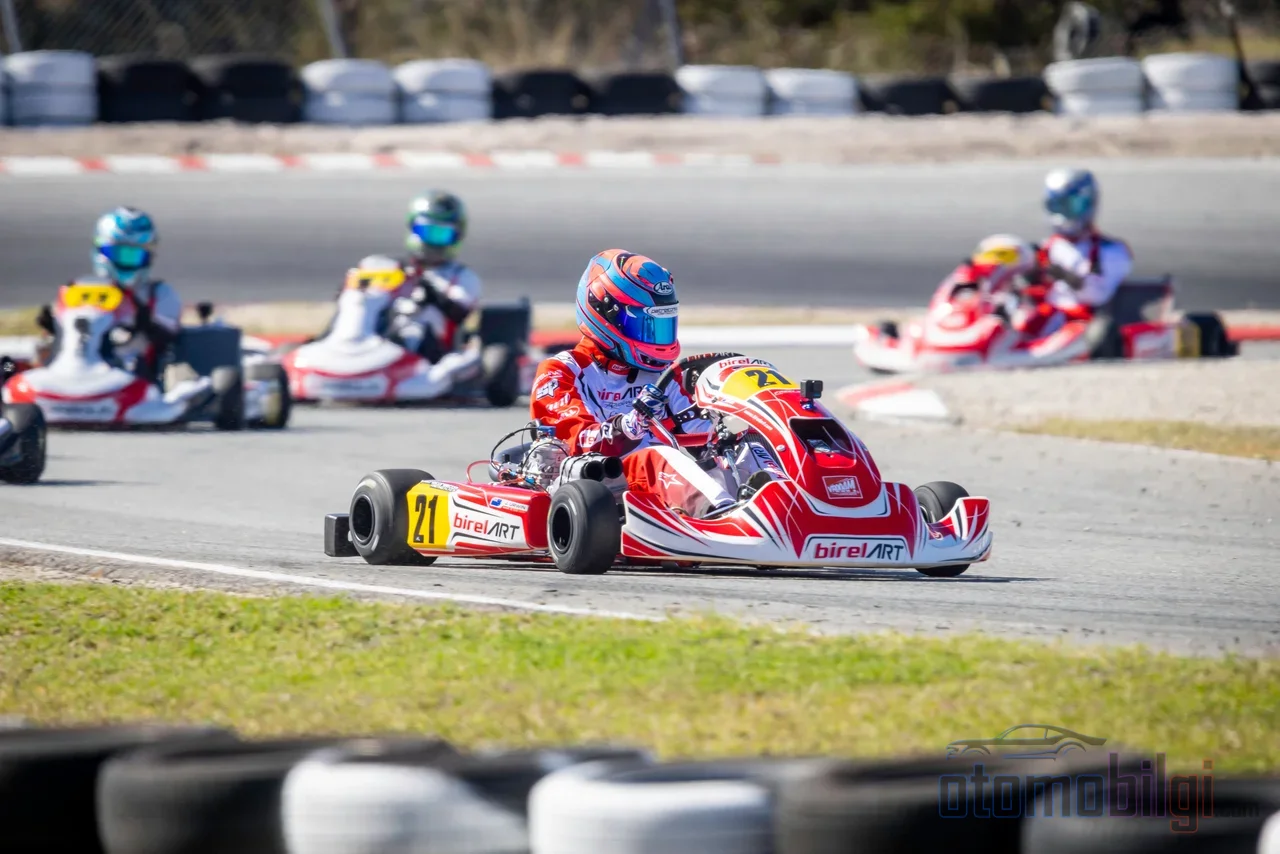
Just think about it: two laps, almost identical. Same entry speed, same corner, you look at the stopwatch and the difference isn't even a tenth of a second. But one lap slows you down on the straight, and the other doesn't. This is exactly where telemetry comes into play in karting: it doesn't tell you how fast you are, but where, how and why you are that fast (or slow). So what gets recorded while this data is collected on track, how is it read after a session, and how does it expose a driver's mistakes? Let's take a look together, because this topic is much more fun than you think.
What Is the Difference Between a Stopwatch and Telemetry?
A stopwatch gives you a single number: your lap time. Telemetry, on the other hand, tells the whole story behind that number. In a session, GPS position, speed, engine RPM, lap and sector times, and even water and exhaust temperatures are recorded. When the session ends, you have a digital copy of every moment of the kart - just like watching a replay of a match at the end of a game.
There is a widely accepted method for reading this data, consisting of four steps:
- Lap and sector times: You compare your best lap with the sectors of a normal lap. Time loss is usually not everywhere on the track; it is concentrated in two or three spots.
- Speed curve: The point where your speed starts to drop is your braking point, the slowest moment of the corner is your minimum speed, and your speed at corner exit affects the entire following straight.
- Engine RPM: On a direct-drive Rotax Senior MAX, a big RPM drop in a corner and slow recovery is a warning sign. Whether you reach maximum RPM at the end of the straight shows whether your gearing is long or short. In geared classes like DD2, gear changes appear as jumps on the RPM graph.
- Temperatures: Water temperature tells you whether the engine is running in the correct range; in two-stroke versions, water and exhaust temperatures are read together.
Highlights
- Phone GPS records position about once per second; it is insufficient for figuring out braking points.
- Time loss usually doesn't happen everywhere on the track, only at 2-3 points.
- In one case analysis, the corner time was the same in both laps (11.9 s); the loss appeared entirely on the following straight: 0.238 seconds.
- The number of sensors and accessories doesn't make the kart faster; it only improves the analysis of your driving and setup.
Karting Telemetry Tools: From Phones to Professional Sensors
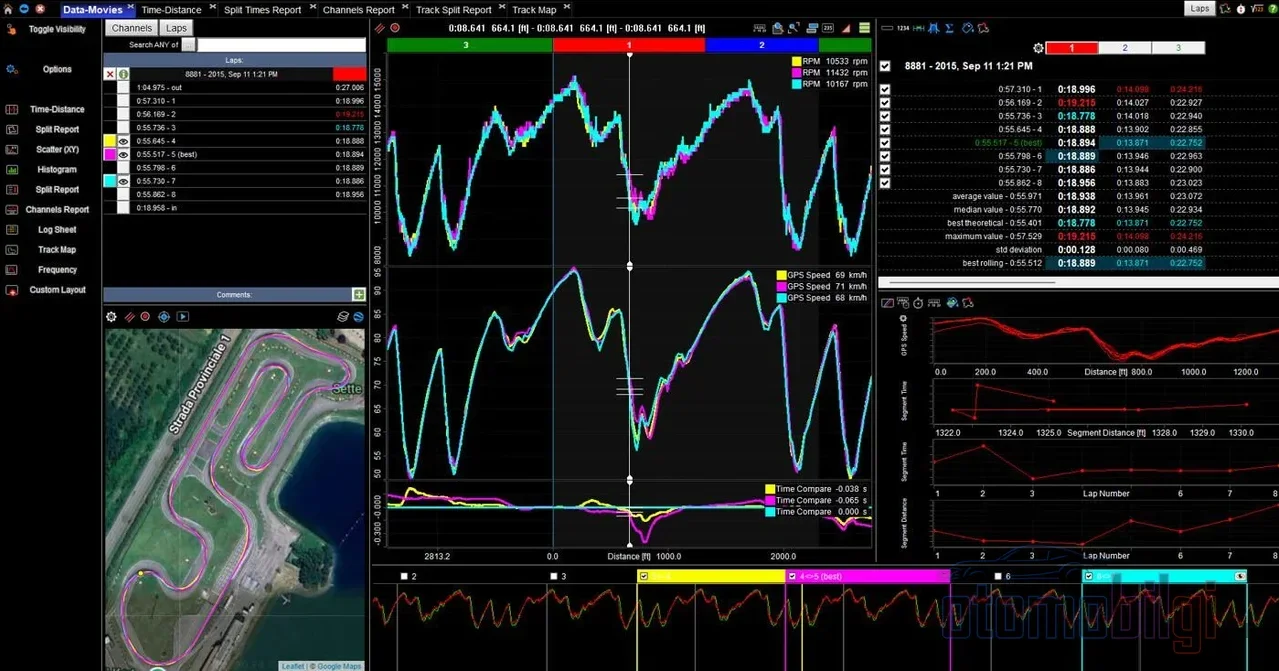
Not everyone starts with the same equipment, and that's perfectly normal. Let me ask you: what's the difference between someone holding a phone to time laps on track and a team driver with a data logger in the cockpit? The answer lies in recording frequency and which sensors are connected.
| Vehicle Layer | What Does It Provide? | Its Limits |
|---|---|---|
| Phone app | About 1 Hz position; ~25 m between points at 90 km/h | Insufficient for braking point and line difference analysis |
| Action camera (with GPS) | Position, speed and acceleration ~10 times per second; G-force ~200 Hz | RPM and temperature do not come from the camera, a dash file is required |
| Dash data logger (e.g. MyChron, Alfano) | High sampling rate, live RPM, temperature, precise lap/sector timing | Correct reading method is still essential for analysis |
| Hybrid use | Dash for live work, camera GPS for post-session analysis | Managing two devices takes some getting used to at first |
There is an interesting detail in this table: sampling rate is not everything. Older camera models sampled 18 times per second with a single satellite system, but what really determines accuracy is the number of satellites in view. New models read four satellite systems (GPS, Glonass, Galileo, BeiDou) together and offer roughly 1.5 meter accuracy outdoors. So higher numbers do not always mean superiority - just like the megapixel race does not alone determine photo quality.
One step up are dash data loggers. With 25 Hz GPS integration, the MyChron 6 offers precise lap and sector timing, track mapping and RPM monitoring. The Alfano 7, with its four satellite systems, records speed, revs and temperature; on two-timer versions you can go up to two separate probes such as water and exhaust. The professional end is academic: A 2023 scientific study addresses much more precise monitoring of kart parameters and driver behavior with GPS-based data collection systems enhanced by RTK.
How to Read the Data? A Real Case Example
Theoretical explanation is nice, but the real wow moment is in actual data. Let's give an analyst an example: two laps, both entering the same corner at 49 mph. The best lap drops to as low as 33 mph inside the corner, while the other lap falls to 27 mph. At the exit the difference is 35 versus 32 mph. Here is the critical point: the corner time is 11.9 seconds in both laps - meaning the loss is not in the corner! That lap ended up 0.238 seconds behind in total, but this loss emerged entirely on the following straight. That small speed difference at the corner exit carries all the way with you to the end of the straight.
Such an in-corner speed drop only becomes visible with dense GPS data. Remember: a kart going at 49 mph travels approximately 22 meters per second. A camera logs position ten times per second, a phone about once. So trying to see what you did in that corner with a phone is like analyzing a match with one photo frame per second.
In another example report, the best lap was recorded as 39.706 seconds with a maximum speed of 101.6 km/h. The main problem was excessive speed loss in a slow and medium-speed corner complex: entering a corner slowed down to 35 km/h, and only reaching 39 km/h at the exit - a loss of about 0.4 seconds. The recommendation is single and clear: aim for a 3-4 km/h increase at minimum speed. In fact, in another example, the 7 km/h deficit seen at the entry of corner 8 was concluded to actually stem from an exit problem in the previous corner. The data also teaches that problems are chained together.
How to Read Brake Points, the Throttle Curve and Chassis Setup Together?
Now let's come to the tastiest part of the job: where driving and setup meet the data. Braking points can be read from longitudinal G-force and evaluated together with minimum corner speeds. In other words, where you come off the brakes is written directly into your speed at the middle of the corner.
There is a classic benchmark in throttle data: how long the driver keeps the throttle above 95 percent throughout the lap. The higher the number, the better - because kart speed is gained not on the straights, but where you can press the throttle all the way down. Steering data also gives another signal: if the recording shows intense correction movements in the corners, the driver is struggling with the racing line or the setup.
A quick analysis routine right after the track is also simple: first look at the lap time, and alongside your maximum speed always check the minimum speed too - because that is the number showing whether the slowest corner was taken faster than the previous lap. Then take a look at the exhaust and water temperatures; any carburation or cooling problem reveals itself right there.
When tire temperature talks to the chassis
Karts have no suspension - tire pressure takes on bump absorption, load transfer and grip production. That is why the relationship between ambient and track temperature and tire pressure is critical: as the air heats up, the air inside the tire expands and the pressure increases. On the sensor side, there are even systems that measure non-contact tire surface temperature; they provide one-to-one data for performance optimization. In practice, looking at the correlation between chassis setup and tire temperature - that is, matching the question of which setup speeds the kart up and which slows it down with temperature differences - is considered the most useful method. As long as the equipment is normal, large temperature differences between the tires may not be observed; for example, even a 30 Fahrenheit degree difference between the two rear tires can carry news value.
How Do Amateurs and Professional Teams Use Data Differently?
The beauty of the amateur side is this: serious analysis can now be done without buying an extra sensor. Class-neutral applications that work with MyChron data; can be used in many classes including Rotax, X30, KA100, OK, KZ and LO206, even in club and rental kart races. Some tools that run through a camera are free at the entry level. For those who do not want to struggle with raw curves, there are also solutions that offer a track map, ranked time losses and coaching notes in plain language - meaning the data can be read even without being a data engineer.
On the professional side, the business is more holistic. In some race teams' programs, data and video analysis, driver development and coaching, and engine and chassis setup recommendations are included as a package. For example, an official race team analyzes the kart's dynamic behavior in relation to driver performance in every detail. In the Arrive & Drive model, telemetry is included in the package; a technician sits down with the driver after every session throughout the day and reviews the data together. This is a somewhat enviable privilege for someone starting out without a technician - but it is also possible to learn the basic methods on your own; the greatest contribution of an experienced technician is saving time by relating the data to the driver's feel and the setup.
The common denominator is this: the number of sensors and accessories does not make the kart faster. They only enable the driving, the setup, and the kart to be analyzed better. For a beginner, working with a small amount of the right data is far more instructive than a huge sensor nest.
The Most Common Analysis Mistakes
There are classic traps everyone working with data falls into - this is perhaps the most valuable part, because knowing them means free speed:
- Only looking at the fastest lap. The fastest lap teaches the most when compared with the segments of a normal lap.
- Looking for the problem everywhere. Start from the segment where the most time is lost; the rest will follow.
- Changing more than one thing at a time. Change the line, the setup, and the gear ratio one at a time; otherwise you will never know what worked.
- Forgetting track conditions. Tires, temperature, and grip change throughout the day; your data changes with them.
What Is the Situation in Turkiye?
Turkiye's karting infrastructure story goes back a long way; the first international karting race was held in 1988. Today, TOSFED Karting Academy organizes training to help young athletes develop and grow; it is clearly stated that the trainings held in Körfez accelerate the athletes' development and aim for success across Europe. There is just one point that caught my attention: there does not appear to be a module dedicated to telemetry in the academy trainings' content. So in Turkiye, young drivers mostly learn data analysis either in a club environment or on their own.
On the track side, timing systems already offer a useful foundation: some tracks can print out individual lap times and results after a session, and show spectators a live scoreboard. Local technical content dedicated to karting telemetry in our country is still limited; existing Turkish-language explanations mostly focus on F1 telemetry. So the gap in this field is large - and in my opinion, learning to read data early could be a sly advantage for a young driver against their rivals in Europe.
How to Go Faster with Telemetry Data?
As promised, let's wrap up the clear answer to the question here. The way to go faster with telemetry is to put the stopwatch aside and read the story: first compare your fastest lap with the segments of a normal lap, find the two or three points where time loss is concentrated, then at those points the speed curve and trace tell you where to move your line and braking - your braking point, your corner minimum speed, and your exit speed. Change only one thing at a time and interpret the tire temperatures together with your chassis setup.
At your next practice session, when you turn on your phone or dashcam, you will no longer just be looking at a lap time - you will be having a real conversation with your kart. Do you know in which corner you are losing time? The data knows. The rest is just listening.
Sources
- Kart telemetry: how to read the data
- Karting Telemetry Analysis App
- Kart Telemetry From Your Onboard Camera
- Kart telemetry: how to work on data to improve performances
- MyChron 6 Data Logger & Lap Timer
- Kart Tyre Temperature Sensors
- How to Find Lap Time in a Kart With Data
- How Tire Pressure Affects Kart Performance
- Real-Time Karting Performance Monitoring via DAQ
- TOSFED Karting Academy Trainings Were Held in Körfez