Crash Tests: The Challenging Small Overlap Test
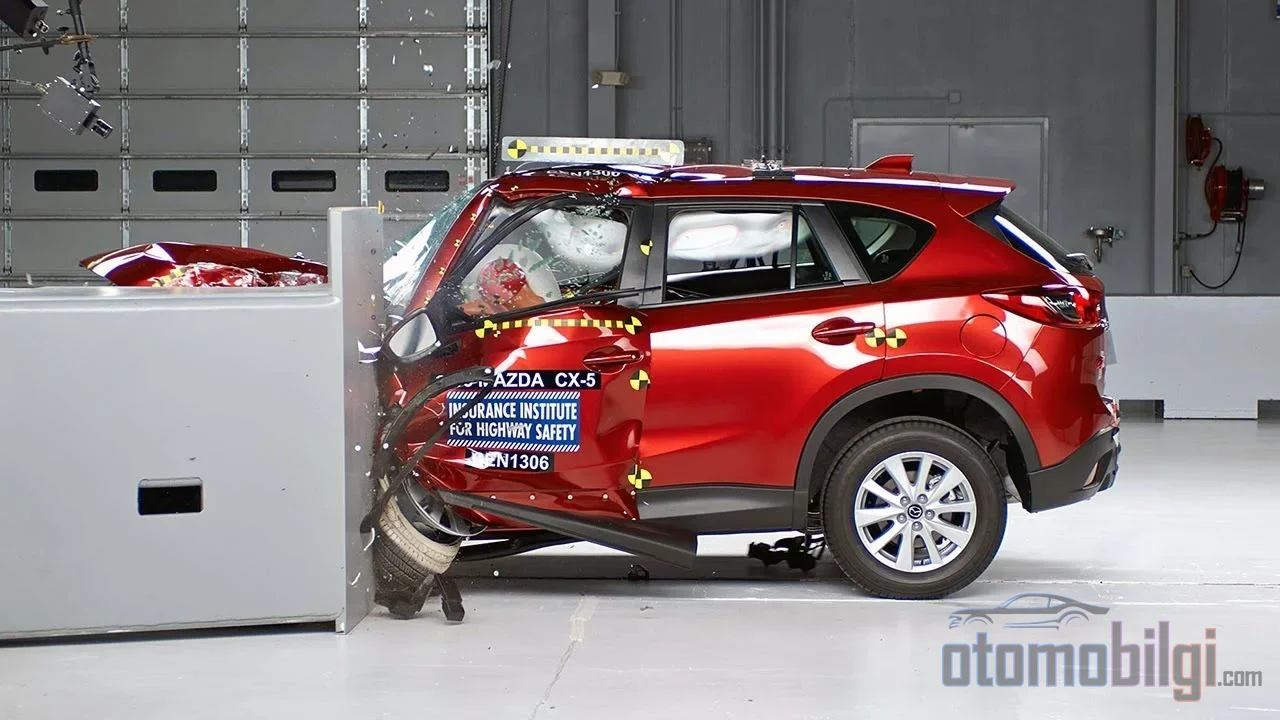
A car earns top marks in crash tests and hits the road; then it crashes into a tree or utility pole at a corner and the cabin crumples in on the driver. The IIHS, one of the first organizations to notice this contradiction, introduced a test in 2012 that changed the entire automotive world's tables: the small overlap test. So what happens when only a quarter of the car crashes that turns the ratings upside down? Let's take a look together at this fascinating corner of crash physics.
What Real-World Accident Does the Small Overlap Test Actually Simulate?
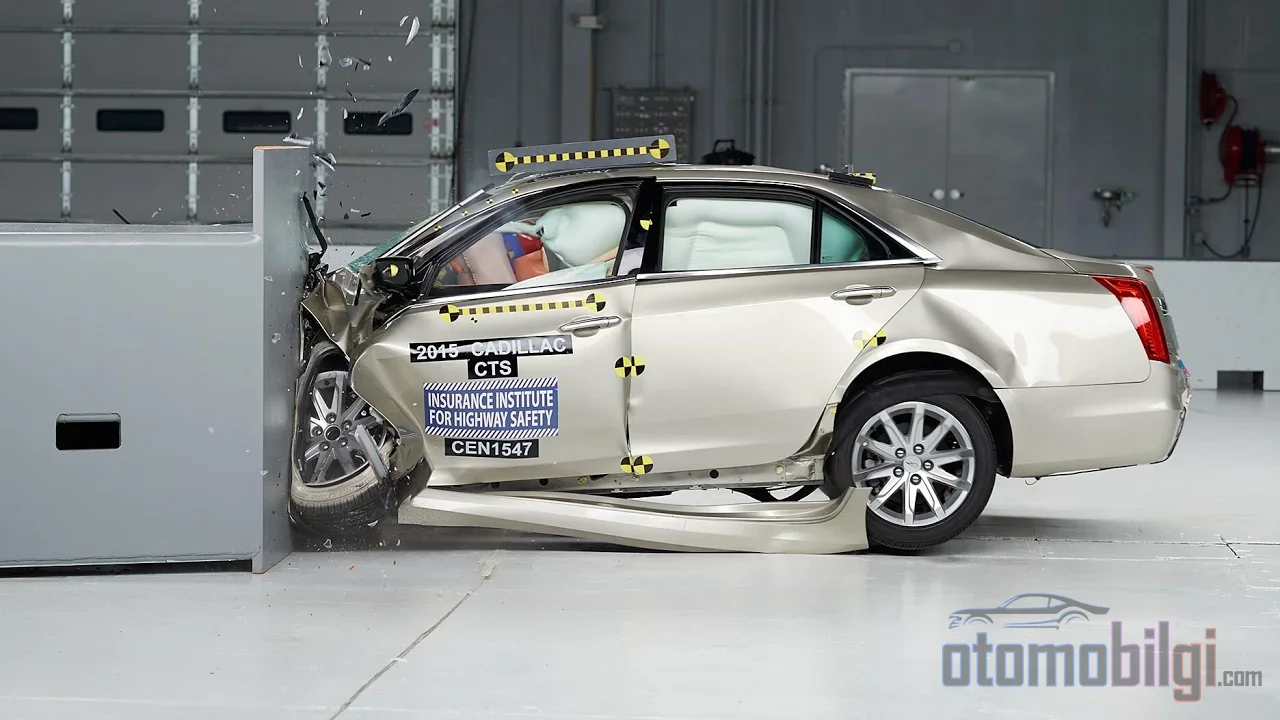
The scenario the test represents is far more common in everyday traffic than you might think: the front corner of the vehicle striking a tree, a utility pole, or the corner of an oncoming vehicle. In such accidents, the entire force of the impact is concentrated on the narrowest area of the vehicle; a large portion of the front bumper never even meets the damage.
Analyses compiled from real-world crashes clearly show just how serious this type of collision is. When frontal crashes resulting in fatalities were examined despite the seat belt being fastened and the airbag deploying, cases were documented in which the two vehicles' left front wheels bypassed each other and intrusions (that is, structures pushed toward the cabin) occurred in the driver's cabin, causing A-pillar deformation. In other words, vehicles that performed well in classic tests were not protecting their drivers adequately in corner impacts. The problem arose precisely from this gap.
What Does the Protocol Include?
The test is conducted with a male dummy (Hybrid III) of 50th percentile dimensions seated in the driver's seat. This dummy is not just an ordinary test prop: its ankles have been modified, accelerometers have been placed on its feet, and ball-bearing sliders have been fitted to its knees. In short, lower-leg strain is one of the most sensitive measurements of this test.
We can summarize the moment of collision with numbers as follows:
| Parameter | Value |
|---|---|
| Impact speed | 64.4 ± 1 km/h |
| Overlap ratio | 25% of the vehicle's width ± 1 |
| Barrier type | Flat 150 rigid barrier (steel front plate, 150 mm radius) |
| Barrier width | 1,000 mm |
| Barrier height | 1,524 mm |
| Dummy | 50th percentile male Hybrid III, in the driver's seat |
A total of six criteria are taken into account in the evaluation: how much the body structure crumpled, the dummy's injury measurements, and whether the airbag and seat belt performed their jobs correctly, among others. Intrusion measurements are taken from 18 different points using a coordinate measuring device; the steering column, brake pedal, left toepan, A-pillar, and rocker panel are just a few of them. In addition, nine external and four in-vehicle cameras at 500 fps record every second. A separate test is applied to the fuel system: leak sampling is performed at the 1st, 5th, and 25th minutes after the collision. In hybrid and electric vehicles, the integrity of the high-voltage system is also checked separately.
There is another interesting detail to this matter: before the test, the vehicle's collision prevention systems (camera, radar sensors) are deliberately disabled. Because this test measures not active safety, but entirely passive safety - the body's ability to absorb the impact.
Highlights
- The test was announced with its first results on August 14, 2012; in the initial evaluation, only 3 of 11 vehicles received a good rating.
- The impact speed is 64.4 km/h, and the overlap is only 25% of the vehicle's width.
- Drivers of vehicles that earn a good rating in the small overlap test have a 12% lower risk of death in all types of frontal crashes.
- Inspired by the small overlap experience, Euro NCAP moved its frontal test to the MPDB barrier starting in 2020.
Why Does a Car That Shines in Full Overlap Weaken at the Corner?
Here is the heart of the problem. In the front section of today's vehicles, there are strong longitudinal beams (frame rails) extending along both sides. These are the vehicle's main crush zones; they absorb collision energy by crumpling and deforming. In a full overlap or 40% overlap test, the impact lands directly on these beams, allowing the system to work as designed.
In the small overlap, however, the situation is completely reversed. The collision forces are applied outside the longitudinal beams, at the outermost edge of the body. They bypass the structures that would normally absorb the energy and load the corner of the body. No distinct crush zone forms in the middle; imagine facing a punch not head-on but from well outside its path, unable to use your arm's strength at all. Just like that, without being able to engage any of its structural advantages, the vehicle's corner alone is forced to meet the impact.
Chain Reaction of Damage: The Wheel, A-Pillar, and All the Parts Pushed Inward
The impact at the corner triggers a chain of reactions. First, the front wheel is jammed against the rigid barrier; the wheel structure, being very rigid, does not crumple easily - instead, it is pushed inward. As the wheel escapes, the impact energy is transferred to the body, bypassing the beams and forcing the body to rotate under a torsional load. The result: the A-pillar, the side column of the windshield, deforms, and the lower hinge area of the driver's door and the components inside the door shift into the cabin. The dashboard, brake pedal, and left toe-pan are also pushed toward the driver's legs.
The wheel's behavior here is something that surprises most people: in tests, you sometimes see the wheel detaching from the vehicle. This is not a failure, but in most cases a deliberate engineering outcome. According to the IIHS, the wheel breaking away or shattering reduces intrusion into the cabin space; the more rigid the wheel structure, the more energy is carried into the cabin. Simulation studies also emphasize that adequate failure modeling must be added to the models in order to capture realistic wheel kinematics.
2012 Announcement: How Did Full-Rating Vehicles Fare So Badly?
In developing the test, the IIHS used vehicle-to-vehicle crashes at a 15-degree angle and angled offset crash methods with a guide rail system. The first results were announced on August 14, 2012, and caused a genuine earthquake in the automotive world: only 3 of the 11 mid-size luxury and near-luxury cars included in the first round of testing managed to earn a good rating. Even models regarded as the safest on the market, ones that scored perfect marks in classic tests, could not withstand the corner impact.
This is no coincidence; passing the full-overlap test and being resistant to a corner collision are two separate engineering goals. At 25% overlap, the load completely bypasses the main rails, so a car cannot defend the brilliant ratings it earned by relying on its rails in this test. When the results for small cars were announced in August 2013, the picture was somewhat better: 6 small cars received good or acceptable ratings; it had become clear that manufacturers were redesigning the corners of their body structures regardless of vehicle class.
The test's real-world relevance was also confirmed over time: drivers of vehicles that earned a good rating in the driver-side small overlap test have a 12% lower risk of dying in any type of frontal crash. In other words, focusing on the corner means an improvement that directly translates into overall safety. Initially, even when the driver side was well protected, the same protection was not guaranteed for the front passenger; that is why the passenger-side small overlap test was introduced later as well.
How Did Manufacturers Reinforce the Corner of the Body?
The solution evolved along three basic axes. First, geometry: extending the bumper outward to create a load path for both sides and optimizing the bumper cross-section. This way, part of the impact energy can be directed into the body's strong structures even though the collision occurs at the corner. There is also an interesting finding from the optimization work: a properly designed front end makes the car slide away from the barrier, so part of the impact energy is converted into the vehicle's kinetic energy instead of structural deformation. In short, rather than fully absorbing the impact, the car cleverly avoids part of it.
Second, local reinforcement. A concrete example: at the beginning of the 2017 model year, the front body structure of a luxury sedan was reinforced; the driver's door, the lower door-hinge pillar, and the interior door components were changed. Manufacturers now look not only at the rails but at every link in the chain extending from the door to the pillar corner.
The third is deliberate energy management: the wheel behavior we mentioned above. Instead of a rigid wheel, a wheel that can break or shatter at certain loads absorbs the energy that would otherwise reach the cabin by breaking itself. Although each of these three moves seems ordinary on its own, when combined, the disastrous ratings from the test's early years gradually turned into serious improvements.
How Did Euro NCAP Benefit from These Lessons?
When IIHS's test made corner vulnerability visible, the European side also reviewed its frontal crash protocol. In 2015, Euro NCAP announced that the offset deformable barrier (ODB) test it had used for many years would be revised; the outcome of the work was the MPDB (Mobile Progressive Deformable Barrier) test, introduced in 2020. Building on real-world crash data and accumulated research on partial-overlap frontal collisions, the Frontal Impact Working Group aimed to reproduce in the protocol the real-world injury potential of small overlap impacts and oblique (angled) offset collisions.
Under the current Euro NCAP regime, the frontal assessment consists of a combination of the 50 km/h MPDB offset test and the full-width test, and the evaluation is based primarily on the vehicle's self-protection, that is, its ability to protect its own occupant in a collision with a vehicle of similar size. The IIHS corner test was not copied into the European protocol on its own; but the message it carried was clear: measuring a vehicle's safety only with impacts applied to the strong region of the body does not reflect reality.
So What Made This Test Special? The Short Answer
The small overlap test is a crash test conducted at 64.4 km/h against a rigid barrier, targeting only 25% of the vehicle's front width. Because the impact falls outside the longitudinal beams that normally absorb energy, it forces the body's most vulnerable corner to withstand it alone; this causes the wheel to be pushed inward, the A-pillar to deform, and returns to the driver as intrusion into the cabin. For this reason, vehicles scoring high in full-overlap tests performing poorly in the early years pushed manufacturers to reinforce the body corners with load paths, and the improvement revealed by the test showed up measurably as up to 12% lower driver death risk in the real world. To my mind, one of the best lessons in how a single test can redraw the skeleton of millions of vehicles.
Sources
- Small overlap front
- Small Overlap Frontal Crashworthiness Evaluation Crash Test Protocol
- Evolution of IIHS ratings
- Development of a Frontal Small Overlap Crashworthiness Evaluation Procedure (Sherwood et al., 2013)
- Fatalities in Frontal Crashes Despite Seat Belts and Air Bags (NHTSA DOT HS 811 102)
- IIHS small overlap frontal crash test ratings and real-world driver death risk (Teoh, 2023)
- Euro NCAP Frontal Impact Working Group Report (Sandner et al., 2017)
- Euro NCAP 2026: What's Changing
- Optimization of Front End Structures for IIHS Small Overlap (Chen, 2019)