How Do You Calculate Your Car's Real Fuel Consumption?
Share This Page
The most reliable way to calculate your car's real fuel consumption is the pump-kilometer method: fill the tank completely, reset the trip meter, drive normally until the tank is nearly empty, and at the next fill-up divide the fuel you added by the distance you covered. Brochure figures come from laboratory cycles, and the average on the trip computer comes from the vehicle's own sensor measurements; neither reflects your real-world usage exactly. This guide explains, step by step, how to correctly determine your own consumption figure with a few tankfuls of measurements and how to interpret that value.
Key Takeaways
- Not a one-time reading, but the average of 2-3 tankfuls represents real consumption.
- Trip computers typically show a deviation of 4-8% and should not be taken as the reference; manual calculation should be.
- In gasoline passenger cars, the average gap between WLTP and real consumption is 16%, and in diesels 10% or so.
- The right basis for comparison is not the price per liter, but the cost per kilometer.
- Aggressive acceleration and speed fluctuations can increase consumption by up to 30% .
The Pump-Kilometer Method: Step-by-Step Measurement
The logic of the method is simple: you measure how far you go on a given amount of fuel. The formula is distance traveled ÷ fuel used ; the result comes out in km/liter. If you are familiar with imperial units, the equivalent is "total miles driven ÷ gallons purchased" - the math is the same, only the units differ.
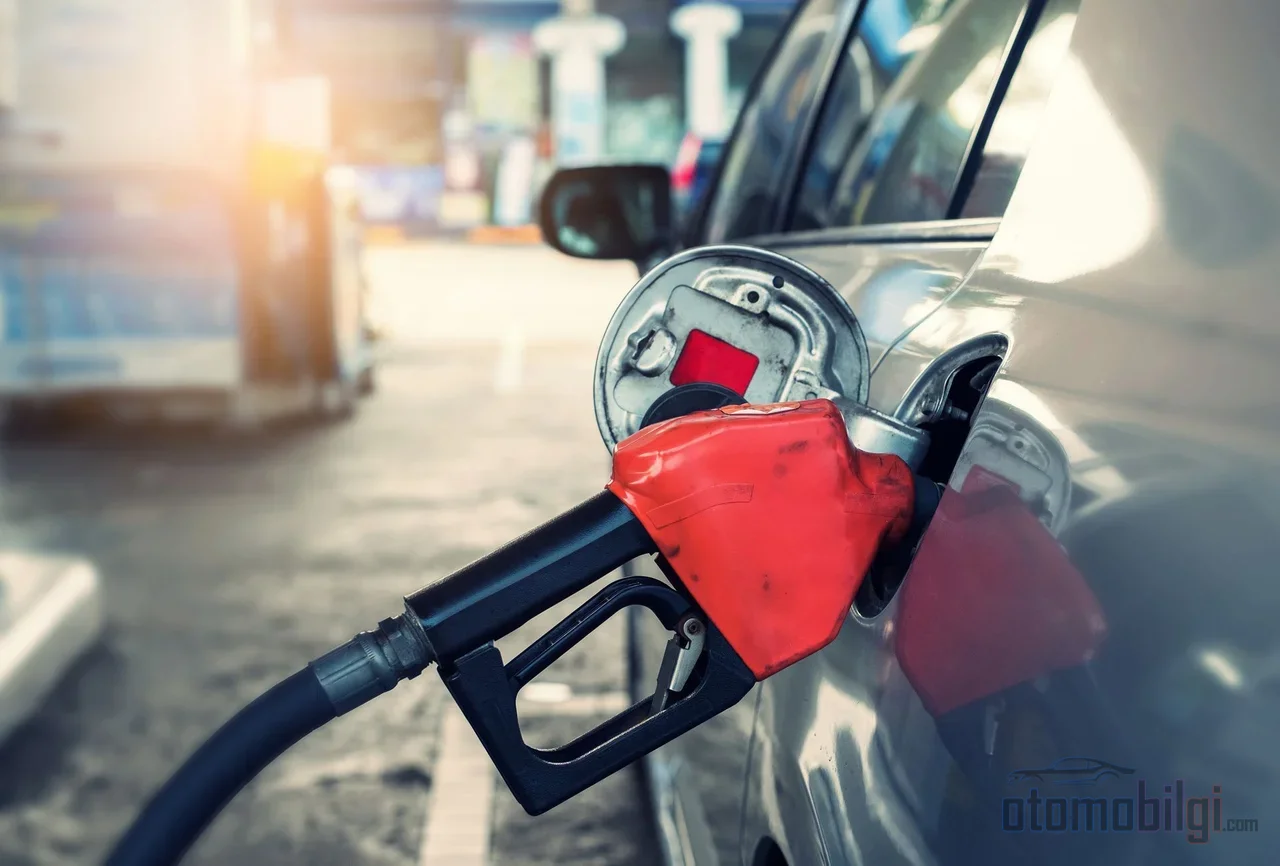
- Fill the tank all the way up ; stop when the pump cuts off automatically for the first time.
- Reset the trip indicator on the on-board computer at this moment. The reset must be done at the full-tank moment, otherwise distance and fuel will not match.
- Use the car normally until the tank is nearly empty. Do not change your driving style during the measurement; what you are measuring is your everyday real usage.
- When refilling, note the liters you added and the kilometers up to that point. Bring the tank back to the same level as the previous fill.
- Divide the kilometers by the fuel added. For example, if you added 36 liters for 480 km, consumption is 13.3 km/l, or roughly 7.5 liters per 100 km.
The critical point is hidden in the last step: the calculation drifts for a vehicle whose tank cannot be filled to exactly the same level at every fill-up. Due to the pump's automatic cutoff, pumping speed, and tank geometry, small differences occur from one fill to the next. That is why a calculation based on a single tank is, in a sense, an estimate.
Why Is One Tank Not Enough?
A hectic week of city driving and a long highway stretch produce completely different consumption figures in the same vehicle. A single-tank measurement captures that one individual stretch; an average smooths it out. Averaging over at least 2-3 tanks is the basic requirement; most people who measure with discipline accumulate at least five full-tank measurements from the same pump and accept the average as the true value. Working with partial fill-ups is possible, but since the tank cannot be emptied at every fill, you need to accumulate total liters and total kilometers separately rather than averaging the individual ratios - in practice, the full-tank method is far less prone to error.
Keeping measurements in a notebook, a spreadsheet, or a mobile app is more valuable than a one-off figure: the trend line that forms over months shows when consumption started to rise. A sudden drop is usually a sign that maintenance is due - a clogged air filter, an old oxygen sensor, or incorrect tire pressure will show itself on this curve.
How Reliable Is the Trip Computer?
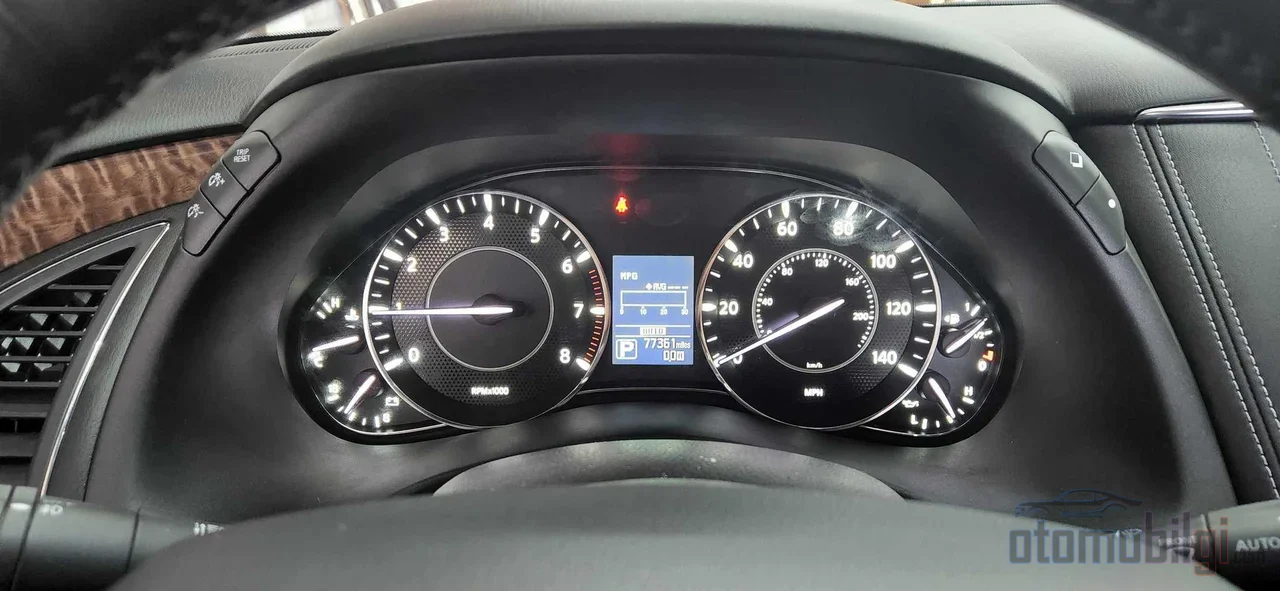
The average consumption display inside the vehicle (technically known as OBFCM) does not measure fuel directly; it estimates consumption based on injector durations and engine data. Although measurements made via OBD are gradually being improved, the margin of error of these displays is significant in practice. Long-term ownership records give a telling example: one vehicle owner reported in a log of 101 fill-ups and about 56,000 km that the display consistently showed values 4% higher than the hand calculation. Similarly, there are cases where hand-calculated values fell 8% below the display; at values above 20 km/l, even a 5% error noticeably changes the figure being read.
There is no need to throw the display in the trash entirely - if it has a consistent deviation, you can apply a fixed correction factor to it. But the method should be this: the hand-calculated value is the reference, the display is a daily tracking tool. If you are going to make an important comparison (for example, if you will see the difference between two fuel types, two sets of tires, or two driving styles), always base the decision on pump-to-kilometer data.
Why Doesn't It Match the WLTP Value in the Brochure?
WLTP is a laboratory test cycle designed to compare all vehicles under the same standard conditions. Its purpose is not to state the real consumption of the vehicle in your garage, but to provide a fair basis for comparison between vehicles. For this reason, a difference between the brochure value and the number you calculate from the pump is the rule, not the exception.
The size of the difference is also measurable: in gasoline passenger cars, the average deviation between WLTP and real-world consumption is 16%, and in diesel passenger cars it is around 10% . For comparison, the US EPA test cycle is more cautious and reports consumption 10-20% higher than WLTP; the European Commission's assessments also point in the direction that the gap between WLTP and the real world needs to be closed.
There is a practical interpretation of this: the WLTP value is referenced to "average use." If your driving profile deviates from that average - if you are in short-distance city traffic, or conversely mostly on the highway - your own measurement will naturally come out different. This deviation does not indicate that the vehicle is faulty; what you are measuring is the difference between the driver the brochure assumes and you.
Comparing Fuel Types: Cost Per Kilometer, Not Liters
The most common mistake when comparing two fuels or two vehicles is to look at the price per liter. The correct measure is cost per kilometer: unit price ÷ km/liter. This formula remains valid even if the fuel type changes, because it reduces both price and efficiency to the same number. For example, a fuel that appears more expensive may come out ahead in cost per kilometer if it allows the vehicle to achieve better consumption - the price per liter alone tells you nothing.
The technical character of fuel types also affects this comparison:
| Fuel | Efficiency character | What to consider in the comparison |
|---|---|---|
| Diesel | 30-41% energy efficiency in passenger car engines; more energy-dense than gasoline per gallon | The unit price of the fuel and maintenance costs should be taken into account |
| Gasoline | Typically 20%, 37.3% in the best cases energy efficiency | Reference value; consumption rises rapidly at high revs |
| LPG | Consumes roughly 15% more than gasoline (e.g. ~9.2 L/100 km instead of 8 L/100 km) | The low price per liter should be weighed against the increased consumption |
On the LPG side, the numbers paint a clear picture: since LPG contains less energy than gasoline, the same vehicle burns more liters; in engine tests, LPG use reduced brake thermal efficiency by 4.52% and increased specific fuel consumption by 5.42% . This does not mean LPG is illogical - the cost-per-kilometer formula gives a numerical answer to the question of whether the price is still advantageous when the increased consumption is factored in. With diesel, the advantage comes from efficiency: engines that are 30-40% more efficient can significantly pull down the cost per kilometer over long distances. But the same calculation also includes the unit price of the fuel and the vehicle's usage profile; on short, city-heavy distances, the price of diesel can erase its consumption advantage.
City or Highway? How Does Your Profile Change Consumption?
The two values you measure yourself in the same vehicle can turn out very different, and there is a single reason for it: stop-and-go. In city driving, a vehicle that frequently stops and starts converts kinetic energy into fuel with every acceleration; while idling, the engine burns fuel but produces no distance - a calculation based on kilometers also penalizes these moments that produce 0 km/l. On the highway, it means steady cruising, rare stops, and consistent gear.
The size of the difference becomes clear with examples: a vehicle that achieves 30 mpg on the highway can drop to ~20 mpg due to city stop-and-go. Official testing methods also acknowledge this reality; city and highway cycles are simulated separately. As a result, your own measurement is the identity card of your driving profile. This is one of the main reasons it does not match the brochure value: if your environment involves 80% city kilometers, no number produced on the assumption of average usage will match yours.
What You Can Do to Improve Your Measurement
The pump-kilometer method does not fix the value it measures; the most effective lever for reducing it is driving style. Speed fluctuations and sudden acceleration can increase consumption by up to 30% ; moderate driving on the highway can achieve 15-30%, and in heavy stop-and-go traffic 10-40% can provide improvement. Speed itself is also a determining factor: the optimum zone is around 90 km/h, and efficiency gradually degrades as speed increases - at the 70 mph band you run 17% less efficiently than you should, and 23% worse at the next step. On the highway, cruise control blocks part of this loss by cutting out small speed fluctuations.
- Tire pressure: every PSI drop means roughly a 0.3% loss in efficiency; check it monthly and before long trips.
- Maintenance: engine oil with the correct viscosity provides a 1-2% improvement; a clogged air filter and a worn oxygen sensor strain the engine.
- Idling: a stationary vehicle produces 0 km/l; on modern engines, waiting longer than about 10 seconds burns more fuel than turning the engine off and restarting it.
- Load and drag: unused roof racks and unnecessary weight reduce fuel economy; open windows at highway speed create drag.
- Air conditioning: in hot climates it can cut economy by up to 25%; cold engines and short trips in winter also push consumption up.
- Slowing down: easing off the accelerator early and coasting instead of braking returns the energy lost with every braking event back into fuel savings.
Misconceptions Mistaken for Savings
Most drivers who start measuring also see the value of some practices that are considered myths. Keeping the tank always full does not save fuel; extra fuel is extra weight being carried. Buying gasoline in the early morning hours brings no meaningful gain in practice due to temperature differences in underground tanks. Premium gasoline only makes a difference when the engine requires it; premium in an ordinary engine does not change your measured km/l value. The effect of magnetic or electronic fuel-saving devices has not been demonstrated in independent tests. Coasting in neutral does not save fuel; in modern fuel-injected engines fuel is cut off when you lift off the throttle, and that mode is already the most efficient state. The claim "automatic transmissions always burn a lot of fuel" is not an absolute rule either - engine efficiency, weight and traffic are more decisive than transmission type.
Conclusion: You Produce the Number, You Make the Decision
Real consumption lives not in a brochure or on the instrument display, but on the receipt at the pump and on the odometer. Fill the tank completely, reset the trip meter, refill to the same level, and repeat this cycle for at least 2-3 tanks. When you take your average, you will have a reference entirely your own, one that exceeds WLTP's 16% deviation and the display's 4-8% drift. Every subsequent decision - fuel type choice, driving style change, maintenance timing - is made based on this number, using the cost-per-kilometer formula. No improvement that is not measured can be verified; the driver who measures, however, decides with indisputable data.
Sources
- How to Calculate Gas Mileage
- Gas Mileage Calculator
- How accurately can we measure vehicle fuel consumption? (Pavlovic et al., 2021)
- Coming back to reality: A proposal for real-world accuracy verification of OBFCM
- Perfect way to measure fuel efficiency
- Trip computer accuracy
- How accurate is your dashboard MPG display?
- Comparison of real-world consumption and WLTP declared values
- WLTP vs EPA vs CLTC: Why estimates differ
- European Commission Report Finds Big Gap Between Real-World and WLTP
- Fuel economy in automobiles
- Fuel consumption comparison: What you need to know
- Characteristics of gasoline engines with LPG (Hashem, 2023)
- Is it still cost-effective to drive on LPG?
- What's the difference between highway and city mileage
- Fuel-efficient driving techniques
- 10 tips to get the most out of a tank of gas
- Gas-saving myths debunked
- Fuel saver device myths busted
- Fuel cost calculator