Telemetry and Data Flow in Formula 1
Share This Page
Telemetry in F1 is the real-time stream of data flowing from the race car to the pit wall and the garage; hundreds of sensors on the car transmit everything from speed and braking information to tire pressure, fuel level, and engine health with millisecond-level precision. In modern Formula 1, strategy, driver performance, and most technical decisions are the product of this invisible data chain.
Highlights
- A modern F1 car carries more than 250 sensors over a race weekend.
- The cars stream approximately 1.1 million data points per second; over the course of a weekend, terabytes of data accumulate per car.
- At European races, the data latency to the pit wall is 10-15 milliseconds, while at distant races like Australia and Japan it is around 300-400 milliseconds or so.
- Thanks to delta analysis, engineers can resolve the time a driver loses in a corner with millisecond-level precision.
- In 1978, physicist Dr. Karl Kempf, hired by Tyrrell, went down in history as the name who brought tape-recorded telemetry to F1.
While watching an F1 race on screen, have you ever thought about this: how do the engineers on the pit wall know what is happening with a driver's tires, how much fuel is left, or whether the brakes are about to give out, before you've even finished watching that lap? The answer is one word: telemetry. And believe me, once you take a look inside, you'll never watch F1 the same way again.
What Is Telemetry and How Many Sensors Does the Car Have?
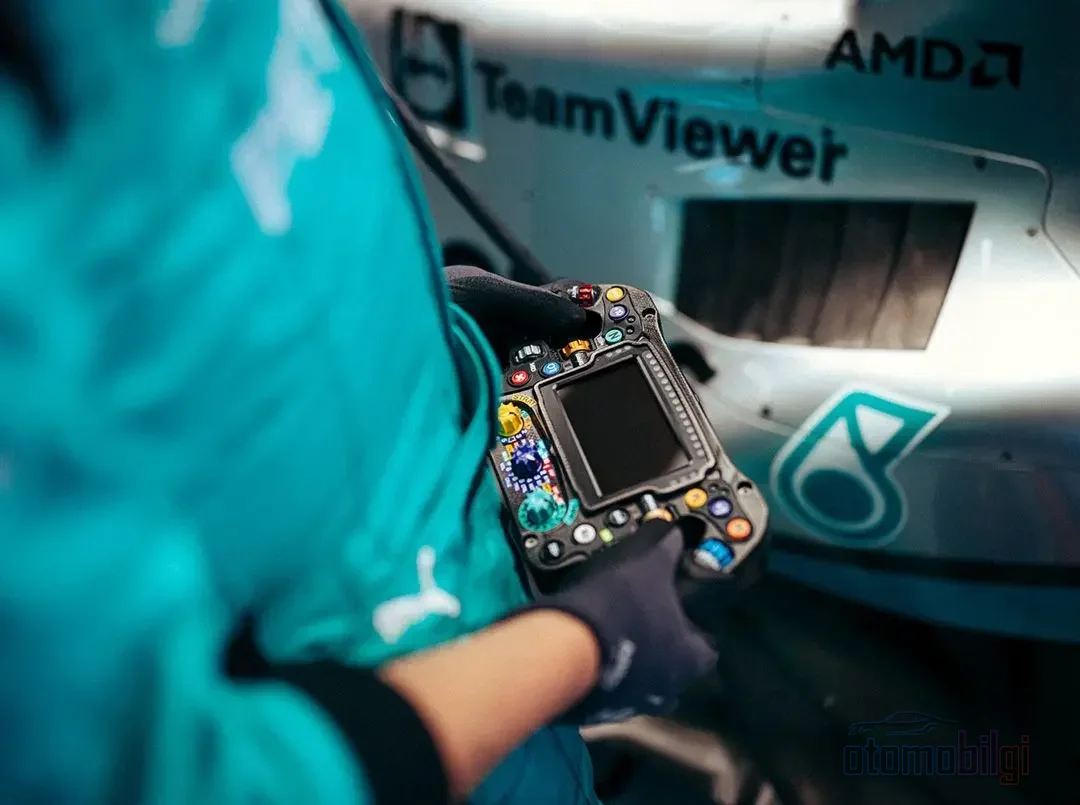
Telemetry, simply put, means all the data collected by the race car while on track being transmitted to the pit wall and the garage in real time. The sensors spread from the bottom to the top of the car continuously measure everything and send it to the team via radio waves. You can think of the car not so much as a vehicle, but as a bundle of sensors moving while connected to a giant computer. In fact, the literature even uses the analogy of a "moving supercomputer" on this subject.
So how many sensors are there? Christine Steven, one of Mercedes' electronic development engineers, says there are more than 250 sensors on the car during an average race weekend; some recent sources put this number above 300 . Sensors are divided into three main categories: control, instrumentation, and monitoring. The power unit, chassis, suspension, tires, aerodynamics, and driver controls are all connected to this network. The FIA also mandates a TPMS system for teams that continuously monitors tire pressure; on the wings and floor, there are thermal imaging sensors that measure tire surface temperature and tire degradation. So what the tire is doing is no longer just something the driver has to "feel" - sensors that can see, like cameras, know it too.
Data rates are not uniform either; they vary from 1 Hz up to 1 kHz. When it comes to vibration data, up to 200 thousand samples per second are possible. The list of monitored channels is incredibly long: speed, wheel speeds, steering angle, front and rear brakes, brake balance, gear, engine RPM, tire pressure, DRS, engine mode, torque, fuel, last lap delta, centrifugal forces, clutch, downforce, hydraulic and oil pressure, engine temperature, transmission, exhaust... The list goes on, but you get the point: every fiber of the car is talking.
How Does Data Leave the Car and Reach the Garage?
Sensors are connected to the car's ECU either analog or via CAN bus lines. The ECU is a standard and custom-made unit for every team; McLaren produces it and all teams use the same hardware. The ECU encrypts the data and sends it to the garage via antennas on the front of the car. Some data is collected the classic way, by connecting a laptop with a cable in the pit; this is called offload, and they use it to download the extra data that live transmission cannot carry.
Live data is around 30 MB per lap; with the offload in the pit, this amount can increase two or three times. For an entire Grand Prix weekend, we are talking about several terabytes per car; when video is included, this amount grows even larger. During the 2022 Mexico GP weekend, approximately 11 terabytes of data were transferred between the track and the factory alone. Then there is the issue of latency: at European races, data reaches the pit wall in 10-15 ms, while at distant races such as Australia or Japan, this rises to 300-400 ms. Imperceptible to humans, but the difference is huge for engineers living by the thousandth of a second. As I go on, let me note this: the telemetry infrastructure itself is common to all teams; this system offering 100% coverage on track is one of the rare examples of inter-team collaboration. On the analysis side, most teams use McLaren Applied's Atlas software.
How Is Time Lost in Qualifying Found?
Qualifying sessions are when telemetry analysis is at its most exciting. As soon as the driver gets out of the car, during that short time between runs, they dive into the screen together with the performance engineer. The goal is single: to find where the time was lost. A team that cannot find 0.1 seconds on Saturday noon starts further back on the grid in the afternoon. So how does this happen?
The magic word is delta. Delta means the difference between two data points; they overlay the data of two laps or two drivers and visualize the time difference along the track. Say your driver is losing 0.15 seconds to their teammate at corner 4. You look at the delta graph and dig into the other channels there: is there a problem with brake pressure, did the driver change the line before the corner, was the throttle application delayed? It can be dissected item by item instantly. For comparison, there is no other way than the teammate; laps from past years, simulated runs, or the driver's own best laps are also on the table.
There is also sector analysis. Combining the driver's best times in S1, S2 and S3 produces a theoretical fastest lap. A big gap between the real lap and the theoretical lap indicates untapped potential in the car. By looking at which sectors the driver is fast in and which ones they are slow in, you can also read setup imbalance; for example, if high-speed sections are good but cornering grip is lacking, it becomes very easy to understand where the car's balance is shifting. On Friday evenings, drivers also review this data again; qualifying and race strategy take shape that night.
Race Day: How Do Fuel and Tire Data Determine Strategy?
Race strategy has two core decisions: when to make the pit stop and which tire compound to choose; hard, medium, or soft? Solid data modeling lies behind these decisions. Strategists calculate the optimal fuel load by looking at the track layout, the expected race pace, and fuel consumption rates. In an environment where the weather, the track, and the rivals can change, this calculation is constantly updated.
Things get even more interesting on the tire side. During practice runs, teams track tire life, monitor fuel consumption, and run scenario simulations. Especially runs longer than 5 laps are read as a dress rehearsal for the race: the degradation curves of two teams on the same compound are compared and it is modeled whether one stop or two stops will be made. As fuel is depleted and the car gets lighter, tire degradation also decreases and performance improves; that's why making a move in the later laps of the race can become logical. Thanks to telemetry, the engineer can see on the screen what happened three laps ago, before the driver has even felt the brakes wearing.
Undercut, Overcut, and Split-Second Decisions on the Pit Wall
Let me tell you my favorite part: the undercut. It means pitting one lap before your rival and being ahead of them when they come out on fresh tires. The overcut is exactly the opposite; staying out and setting fast laps on track after the rival has pitted. Which one is better depends on tire degradation data and the probability of making a pass on track. Without telemetry, these decisions would be left entirely to instinct. With data available, the engineer can model the undercut moment in advance and calculate exactly the right lap. If tire wear is low, bold plans like going aggressive in the final laps while the rival preserves their tires can also come onto the table.
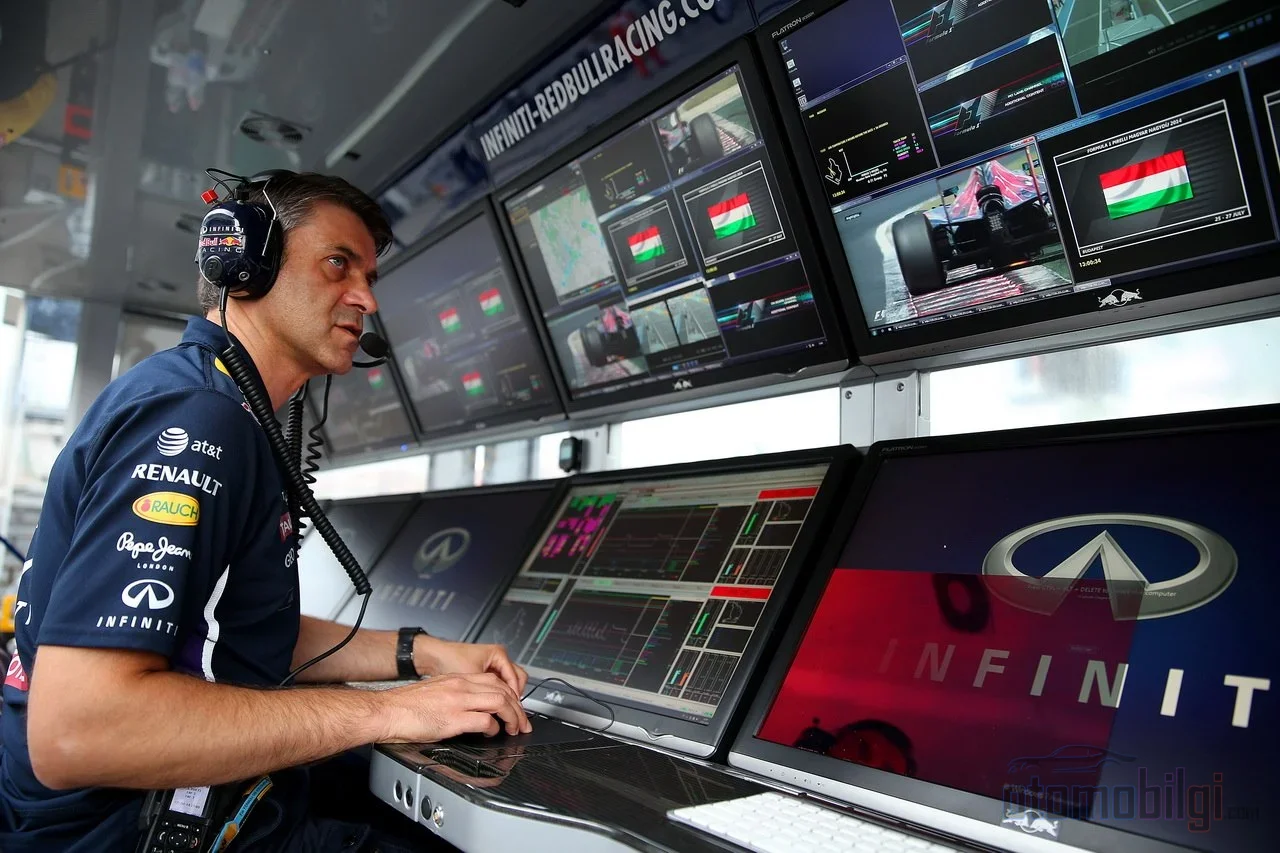
The pit wall is not idle during this time; engineers monitor telemetry in real time and guide the strategy. Artificial intelligence is now also at the table; there are predictive analysis efforts aimed at detecting mechanical failures in advance from sensor data. Additionally, on the broadcaster's side, analysis systems that use real-time data to predict track conditions, weather, and rival strategies, and present visual standings to the viewer, also work on top of this data stream. In other words, those sleek graphics you see on your TV screen are also products of the same sensors.
The Factory Side: Mission Control and the Data Chain
Its telemetry doesn't stay on the track; it's the first link in a giant chain stretching from the track to the factory. From the sensors on the car to the ECU, from there it is encrypted and sent to the pits, then to the garage, and finally to the factory. On the factory side, the data is processed in the dynamometer, simulator, aerodynamics departments and the wind tunnel. So a vibration measured on the track on Saturday morning can turn into the design of a new part at the factory during the week.
The hierarchy on the track is also clear. In Mercedes' case, there are five key engineering roles per car: specializations such as Race Engineer, Performance Engineer, Controls Engineer and Engine Performance. Each is responsible for a different slice of the telemetry. Driver inputs, meaning brakes, throttle, steering angle, the buttons on the steering wheel, aerodynamic sensor data and the power unit's temperature and pressure values all flow to these teams.
The "Mission Control" rooms at the factory are the bridge between the track and the design engineers. Housing the strategy team as well, these rooms, as at the McLaren Technology Centre or Aston Martin, monitor data streams and simulations live even from thousands of kilometers away from the race track. While the race is running, an engineer at the factory can look at the same graph at the same time as their colleague on the pit wall. Incredible, isn't it?
Is Data Everything? The Human Factor
Okay, everything is on screen, but the machine doesn't have an answer for everything. Experienced engineers can override the model when it comes to contextual knowledge that the simulation cannot capture. The driver's feel for the tire is the best example of this; even if the screen says "the tire is fine," the driver can say "the rear wing setting is perfect for me," and this subjective preference cannot be erased by data. F1 is still the joint work of human and machine; data is a powerful assistant, but there's still a human sitting at the wheel.
A Brief History of Telemetry: From 1978 to Today
It all started relatively modestly. In 1978, Ken Tyrrell brought American physicist Dr. Karl Kempf onto the team. Kempf carried into F1 the tape-recorded telemetry method he had developed at Goodyear; speed, suspension movements, directional forces, throttle and braking were being recorded with sensors. You can guess how laborious it was; even adding a microprocessor was mind-boggling at the time due to electrical noise and vibration problems.
Then computers came into play and everything changed. Data became more accurate, sensors shrank and multiplied; telemetry contributed directly to the exponential growth of racing technology. Today, things have reached a point where the machine is nearly flawless and development has plateaued. Just think: from a few channels recorded on a tape in 1978 to 1.1 million data points per second today. This leap over nearly 50 years turned F1 from a pure speed race into a data race as well. Next time you watch a race on screen, take a look at the pit wall; you will no longer see just confused engineers there, but people managing a real-time data storm.
Sources
- Feature: Data and Electronics in F1, Explained!
- INSIGHT: The Trackside Engineers
- Formula One Telemetry: Explained
- How Data Works in Formula 1
- How Data Moves in Motorsport
- F1 race cars have 300 sensors
- F1 Race Charts Explained: Lap Times, Tyres & Telemetry
- How F1 Teams Use Telemetry, Control, and Analytics to Go Faster
- How Race Strategy Works In Formula 1
- A Look Inside a Formula One Team's Mission Control
- F1 Insights - AWS