What Does Energy Density Mean in a Battery

Share This Page
Energy density is the measure of how many watt-hours of energy a battery can store per kilogram or per liter: Wh/kg expresses energy stored per unit of mass, Wh/L per unit of volume. The higher this value, the lighter and more compact the battery needed for the same range or usage time.
Highlights
- Modern lithium-ion cells typically operate 150-300 Wh/kg and 250-700 Wh/L within this range.
- High-nickel NMC811 cells deliver 250-280 Wh/kg at the cell level; LFP mostly stays in the 90-200 Wh/kg band.
- A 260 Wh/kg cell drops to roughly 180 Wh/kg at the pack level once the enclosure, cooling and BMS are added.
- Energy density and power density are not the same thing: one measures the amount stored, the other the rate of release.
- Semi-solid batteries are on the road at 350-420 Wh/kg; the full solid-state target is to exceed 400-500 Wh/kg.
Look at the brochures of two electric vehicles and see that both promise a similar range. Then open up the technical specifications of the battery packs: one can be a hundred kilograms lighter than the other, with a noticeably smaller volume in liters. The range is the same; the mass and volume are very different. The key to this difference is energy density and the efficiency lost (or recovered) on its journey from cell to pack. In this article, I will explain step by step what Wh/kg and Wh/L mean, how cell chemistry and pack design determine this figure, and why the same kWh does not mean the same weight.
What Exactly Does Energy Density Measure?
Energy density has two faces, and both describe the same physical reality from different angles. Gravimetric density (Wh/kg) gives the energy stored per kilogram; wherever weight is critical - electric vehicles, drones, aircraft - this figure is decisive. Volumetric density (Wh/L), on the other hand, shows the energy stored per liter and comes into play in designs where space is limited - smartphones, compact devices, cramped engine bays.
Let's make the number concrete. A 250 Wh/kg battery delivers 250 watt-hours of energy from each kilogram; a 400 Wh/kg battery carries nearly twice the energy at the same weight. Modern lithium-ion cells move across a wide band, roughly 150-300 Wh/kg and 250-700 Wh/L; where you fall within this range is determined by cell chemistry and cell design. The striking part is the historical curve: 30 years ago, standard lithium-ion cells were only around 80 Wh/kg. Today, premium designs exceed 300 Wh/kg - roughly a fivefold improvement and a cost reduction exceeding 90 percent occurred in the same period.
Why Are Energy Density and Power Density Confused?
These two concepts are the most frequently misunderstood aspect of the question "What Does Energy Density in a Battery Mean?". Energy density tells you how much fuel is in the tank; power density (W/kg) shows how fast that fuel can be burned. A high-energy cell means long range; a high-power cell means instant acceleration and rapid energy discharge. They are different measures and cannot be reduced to one another.
The trade-off is also concrete: energy-optimized cells typically deliver 240–280 Wh/kg while providing only 200–400 W/kg of power. Power-optimized cells, conversely, reach 1500–3000 W/kg but fall back to the 150–200 Wh/kg band. The physical reason is electrode thickness: thick electrodes carry more active material and increase energy, but they lengthen the diffusion path that ions must travel and reduce the ability to deliver high current. Optimizing one usually means giving up the other.
Cell Chemistry: The Density Difference Between NMC and LFP
Cathode chemistry is the first item determining a cell's density ceiling. Nickel-based NMC cells are in the 150–250 Wh/kg band; as the nickel ratio increases, so does density - NMC811 formulations reach 250–280 Wh/kg at cell level, and in some designs values above 260 Wh/kg. This makes NMC the natural choice for long-range electric vehicles. The price is thermal stability: as the nickel ratio rises, the cell's thermal runaway tolerance narrows.
LFP (iron phosphate) chemistry, on the other hand, is in the 90–200 Wh/kg range; while sources vary on the lower and upper bounds of this band depending on measurement method, the common denominator is that LFP lags behind in density. In return, it offers superior safety, strong thermal stability, and a lifespan of 3000–5000 cycles - NMC622 cells are limited to 1500–2500 cycles, and NMC811 to 1000–2000 cycles. LFP is also 20–30 percent cheaper than NMC per kWh and less prone to fire.
| Feature | NMC | LFP |
|---|---|---|
| Gravimetric density | 150–280 Wh/kg | 90–200 Wh/kg |
| Cycle life | 1000–2500 cycles | 3000–5000 cycles |
| Strength | Density, compactness | Safety, lifespan, cost |
| Weakness | Thermal stability | Weight and volume |
| Ideal use | Long-range EV | Safety- and lifespan-priority use |
Let's see what the density difference means in practice with a volume example: LFP's 30–40 percent lower density can mean that for the same energy, an LFP system requires 450 m² instead of the 300 m² needed by an NMC-based system. In a facility where urban land costs are high per square meter, this difference alone can justify the price premium of high-density chemistry. At the base of the vehicle, the translation is this: a manufacturer choosing LFP carries a larger and heavier pack for the same range, or gives up range.
Same Range, Why Different Size and Weight? Cell-to-Pack Losses
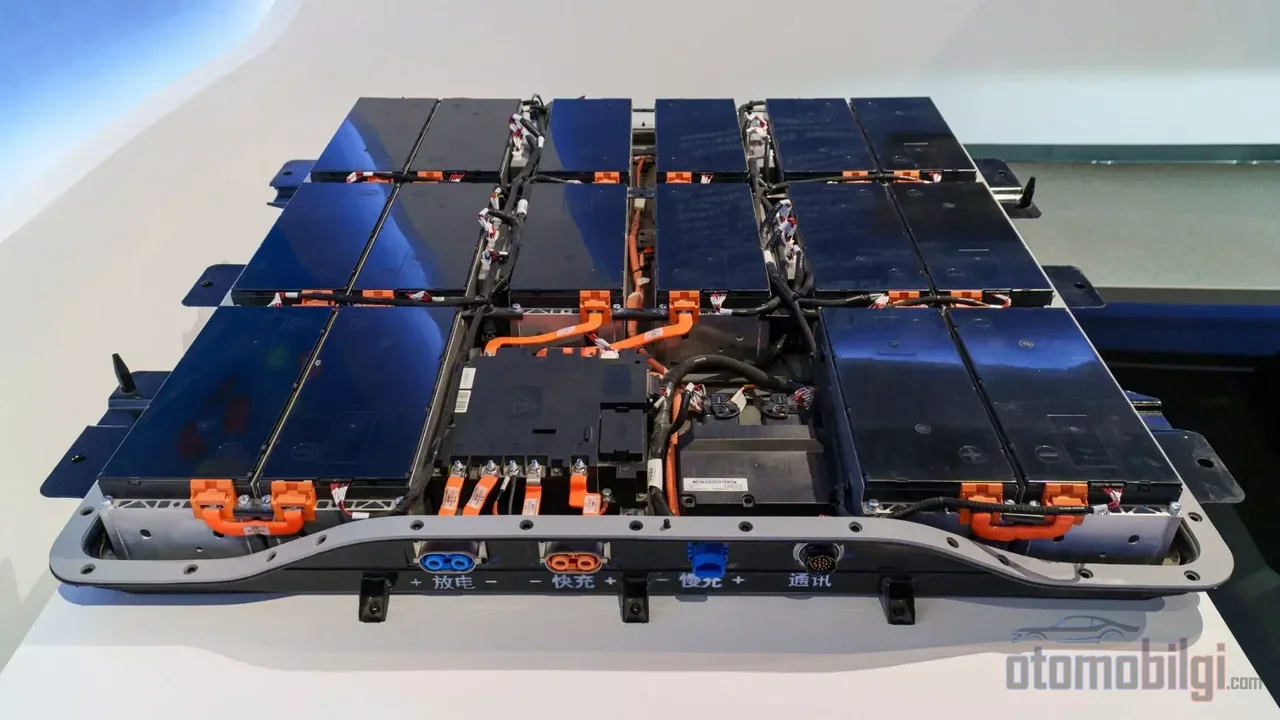
Most of the numbers we've discussed so far belonged to the cell level. Yet what is installed in the vehicle is not the cell, but the pack - and the pack is the sum of everything wrapped around the cells: enclosure, cooling system, BMS, interconnects. Cell-to-pack efficiency is therefore the second determining factor. To give an example: a 260 Wh/kg cell can provide only roughly 180 Wh/kg in the pack when all this hardware is included. A good cell-to-pack (CTP) design can recover 10–20 percent of this loss.
Cell-to-Pack Mass Ratio and CTP Design
The metric engineers use is the share of cell mass within the total mass of the pack. In typical packs, 65-85 percent of the cell density is carried over to the pack level; in CTP designs this efficiency reaches around 80 percent. The logic of CTP is simple: eliminate the intermediate module layer. Using fewer but larger cells means fewer intermediate connections, lower material costs, and tighter packaging. Structural designs push density even higher by reducing the packaging burden - advanced integration concepts can even make low-cell-density chemistries (such as LFP) competitive at the pack level.
The cell format also works on the volume side: the natural gaps of cylindrical cells reduce system-level volumetric density by 20-30 percent compared to the cell level; prismatic cells are packed more tightly. A practical case: an e-bike manufacturer switched to a prismatic design, gaining a 20 percent volumetric improvement at the cost of a 5 percent gravimetric loss, and increased total usable capacity. Which axis of improvement is worthwhile is an engineering decision that depends on the product's design constraints.
Range Per Kilogram: How Much Does Pack Weight Actually Cost?
Electric vehicle battery packs are typically in the 60-82 kWh range and carry roughly 5-8 kg of mass per kWh - meaning a density band of 125-200 Wh/kg at the pack level. For a concrete scale: 6-12 kWh batteries weigh 100-150 kg; 60-100 kWh packs come in at 350-600 kg. As a reference, the Tesla Model 3 battery, at 481 kg of mass, has roughly 156 Wh/kg of pack density.
This weight itself is the enemy of range: doubling the battery size does not double the range, because every extra kilogram you carry consumes its own energy for transport. This is where the curve of diminishing returns begins. Here is the three-component formula explaining why two batteries offering the same range can have very different masses: cell chemistry (the difference between NMC and LFP), cell-to-pack integration efficiency, and the added burden that cooling and structural design place on mass. The manufacturer that manages all three well produces a lighter car with the same kWh.
Where Do New Chemistries Want to Take This Number?
The promise of solid-state batteries is to increase both safety and density at once by replacing the liquid electrolyte with a non-flammable solid structure: a potential of 350-700 Wh/kg. But as of 2026, those hitting the road are semi-solid batteries - designs commercialized in the 350-420 Wh/kg band. The target for fully solid-state is to exceed 400-500 Wh/kg, with the long-term goal above 500 Wh/kg; results reaching 600 Wh/kg have been announced in the lab. The obstacles in between are manufacturing complexity, cost, and stability at the solid-liquid interface. The 400-500 Wh/kg threshold is seen as a critical threshold, especially for aviation and long-range EVs - but today these values are mostly at the laboratory and prototype level.
At the other end of the table is sodium-ion: in the 75-160 Wh/kg band, it cannot compete with lithium-ion in density. What puts it forward is not density but raw material abundance, low cost and cold weather performance; CATL's Naxtra cell sits at the top of the band with roughly 175 Wh/kg. In short-range and price-sensitive applications, a slightly larger pack is an acceptable price to pay. Energy density is not the sole king in every application; but before deciding how much space it will take up on a scale, you must know this number.
Conclusion: What to Look For When Reading the Density Number?
When you see Wh/kg on a battery spec sheet, the first question to ask is: is this a cell value or a pack value? The cell value shows the ceiling the pack can reach; the pack value is the reality that actually lands in the vehicle. The latter falls in the range of 65-85 percent of the former. The second question is chemistry: if safety and lifespan are your priorities, LFP is a sensible starting point; if compactness and range are your priorities, high-nickel NMC makes sense. And never confuse energy density with power density - one tells you how much you can carry, the other how fast you can spend it. The reason two batteries offer the same range with different masses is that these three variables differ in how well each manufacturer handles them.
Sources
- Energy Density of Lithium-Ion Batteries with Real Examples
- Understanding Battery Energy Density for Solar Storage
- Power Density vs Energy Density
- From NMC to LFP batteries
- LFP Vs NMC Battery: A Technical Comparison Of Cycle Life
- From Cell to Pack: Empirical Analysis of the Correlations
- Cell-to-pack batteries
- How Much Does an Electric Car Battery Weigh?
- Next Generation Batteries Are Imminent
- Solid-State Battery Hype vs. Reality: 2026 Edition
- Solid-State Battery Status in 2026
- New Battery Technologies 2026