How Many Years Does an EV Battery Last? Behind the Scenes of Degradation
Share This Page
Current electric vehicle batteries typically serve 10-15 years ; fleet data shows an average annual capacity loss of 2.3% and an average remaining capacity of 81.6% at the end of 8 years. This loss is no accident: measurable mechanisms are at work inside the cell, such as the depletion of the lithium inventory, the degradation of the electrode material, and the increase in internal resistance. On this page, I explain how quickly those mechanisms operate, the effect of charging habits and temperature, and what warranty periods actually commit to.
Highlights
- Fleet data from more than 22,700 EVs: average annual loss of 2.3%, with 81.6% capacity remaining after 8 years.
- Frequent fast charging above 100 kW raises the annual loss from ~1.5% to ~3.0%.
- Standard warranty: 8 years/100,000 miles and usually a 70% capacity threshold.
- LFP cells deliver 3,000-10,000+ cycles; NMC typically 1,000-3,000 cycles.
- When a battery completes its life in the vehicle, the road does not end: in stationary storage it can operate up to 60-70% SoH.
Three Separate Degradation Modes Operate Inside the Cell
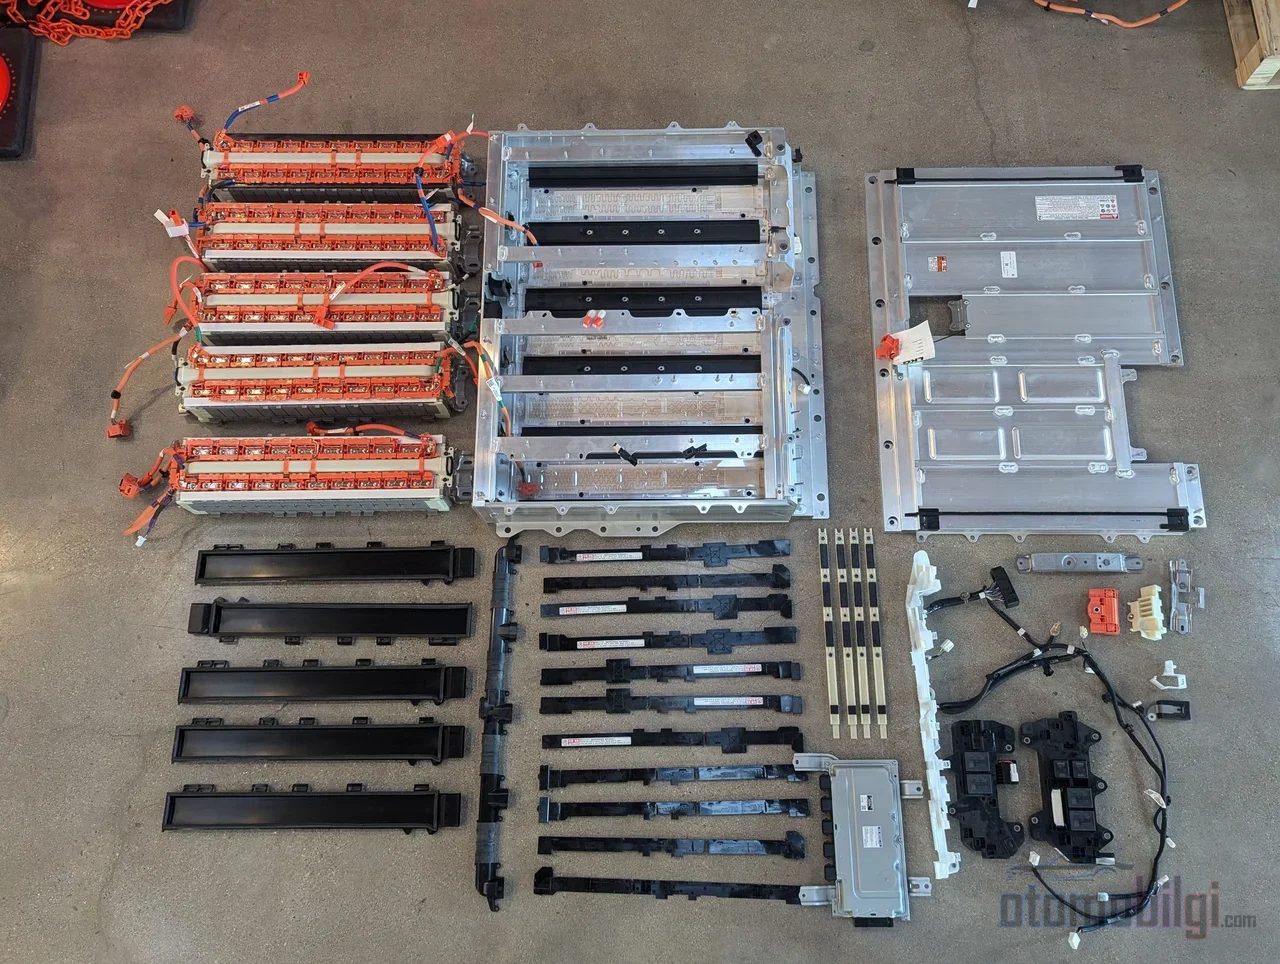
Reducing battery aging to a single concept of "wear and tear" is misleading. The literature distinguishes three separate modes, and each appears with a different symptom. The first is lithium inventory loss: chargeable lithium ions are consumed by side reactions; the electrodes remain physically intact, but the lithium circulating between them decreases and capacity drops. The second is loss of active material: particles crack, binder contact breaks, or the crystal structure transforms, and a portion of the electrode material drops out of the reaction. The third is impedance growth: the capacity measured at low current may remain almost the same, but the cell's ability to deliver power declines - meaning the battery may still hold plenty of energy but no longer has the power to deliver it quickly.
This three-way distinction matters in practical terms, because a vehicle's range loss and the lengthening of fast-charging times are signs of different mechanisms. Knowing which mode is dominant when diagnosing the problem also tells you what can be corrected: inventory loss cannot be compensated, while resistance growth can be partially masked through thermal management.
The anode side: SEI growth and lithium plating
On the surface of the graphite anode, a thin layer forms during the first charge: the solid-electrolyte interphase, or SEI for short. This layer is necessary for the anode to function; the surprising part is that it is not a perfect passivator and continues to grow slowly throughout its entire life. Each growth step consumes some lithium. The growth rate slows roughly with the square root of time, accelerates with temperature in an Arrhenius-type manner, and speeds up at high state of charge (SoC). This is why SEI growth is the main driver of calendar aging while the vehicle is parked.
The more dangerous mechanism is lithium plating. If lithium ions arrive too quickly to fit into the graphite surface - especially at low temperature, high charging speed, or high SoC - the anode potential drops below zero and the ions deposit on the surface as metallic lithium instead of taking their places. Some of the plated lithium can re-enter the cycle during rest; the rest becomes dead lithium or forms dendrites that extend toward the separator. What makes plating the most dangerous mechanism is that it not only causes capacity loss but also directly affects safety. Moreover, since an aging cell has narrower anode pores, it plates more easily than a young cell at the same charging speed.
Additionally, graphite expands by ~10% with each cycle, and by ~300% when silicon-based additives are used. This repeated swelling cracks the particles; every crack means fresh surface, and fresh surface forms new SEI - the loss feeds itself. As a lower-bound note: over-discharge can dissolve the copper current collector. This is irreparable damage, and by forming metallic copper bridges it can short-circuit the cell.
Cathode side: dissolution, microcracking, and oxidation
The cathode has its own ledger of problems. In nickel-rich cathodes, transition metals can dissolve into the electrolyte; manganese in particular migrates and reaches the anode, accumulates inside the SEI layer, and there catalyzes further reduction of the electrolyte. The magnitude of this "crosstalk" effect is measurable: under high stress conditions - 60 °C and 4.6 V upper cutoff voltage - significant metal accumulation on the anode was recorded in NMC811/graphite cells in only 120 cycles; at room temperature and 4.2 V, the same duration brought values far below that. In other words, dissolution scales strongly with both temperature and the voltage window.
Three more mechanisms are added to this. Polycrystalline nickel-bearing cathodes microcrack along grain boundaries; single-crystal cathode morphologies were developed precisely to solve this problem. Surface conversion to spinel and rock-salt phases creates a highly resistive shell. And at high potential, the electrolyte itself oxidizes and produces gas - keeping the upper cutoff voltage low is therefore significant not only for capacity but also in terms of swelling and safety.
Calendar Aging or Cycle Aging?
A battery lives by two separate clocks. Calendar aging works even if the vehicle never moves: the loss produced by time itself, governed by SoC and temperature. A vehicle parked in summer heat at 100% SoC accumulates calendar aging without ever setting off. Cycle aging, on the other hand, is driven by the effort of charge-discharge; its dominant mechanisms are lithium plating, particle cracking, and SEI cracking.
Their weight is not the same in every setting. In grid storage systems, calendar aging is estimated to account for up to half of total capacity loss. In the EV context the ratio varies by model and climate, but the lesson is instructive: where you leave the battery and at what charge level matters as much as how many times you charge it. This fits with a modeling study built on 62 automotive cells and 28 protocols, which found the SoC window to be the factor most affecting SEI growth.
How Much Is Annual Loss in Real-World Use?
Mechanisms build the narrative; scale comes from real fleet data. According to an analysis covering more than 22,700 vehicles and 21 models, current EVs lose an average of 2.3% capacity per year, and after 8 years an average of 81.6% capacity remains. Charging habits are a visible lever in this picture: vehicles that used DC fast charging in less than 12% of their sessions show ~1.5% annual loss and sit at ~88% after 8 years, while those that frequently charged above 100 kW lose ~3.0% per year and drop to ~76% over 8 years.
Segment and climate also make a difference. Light cars lose ~2.0% per year, while vans and MPVs rise to 2.7%. Hot climates add +0.4 points to annual loss compared to temperate environments. The general rule is this: extreme cold reduces range in the short term, but the real lasting damage comes from extreme heat - high temperature is the vector that accelerates chemical reactions and speeds up material degradation. A 17-18% drop in range at 38 °C and above is a short-term effect; sustained high heat permanently accelerates degradation.
| Usage profile | Annual capacity loss | Remaining capacity after 8 years |
|---|---|---|
| Fleet average (21 models) | ~2.3% | ~81.6% |
| Fast charging used in less than 12% of sessions | ~1.5% | ~88% |
| Frequent fast charging above 100 kW | ~3.0% | ~76% |
| Light cars | ~2.0% | - |
| Vans / MPVs | ~2.7% | - |
| Hot climate add-on | +0.4 points | - |
LFP or NMC: Does Lifespan Depend on Chemistry?
Short answer: yes, but the advantage depends on who is looking at what. In cycle life, LFP is clearly ahead: 3,000-10,000+ cycles, while NMC typically delivers 1,000-3,000 cycles under the same conditions. Temperature tolerance shows a similar picture: at 45 °C, NMC's cycle life can fall 40-50% below its rated value, while LFP degrades more mildly under the same conditions. In return, NMC offers higher energy density; when mass and volume constraints are decisive, NMC's advantage comes into play. LFP's flat voltage curve makes SoC estimation difficult and requires frequent 100% charges for BMS calibration - meaning that always trying to keep an LFP vehicle at 80% may, interestingly, be the wrong advice.
There is also a point that has not yet been clarified: in user discussions it is reported that LFP packs dropped below 90% within a few years, while NMC appears at 100% thanks to warranty buffers. This gap between apparent performance and actual degradation can be explained by the measurement method and the manufacturer's buffering strategy; at this stage, saying there is no "universally better" chemistry is the most honest assessment.
Non-Linear Aging: The Knee Point Problem
Most cells degrade with an almost linear slope for a long time, then capacity begins to drop rapidly. This turning point is called the "knee point," and it is not a new mechanism but a threshold transition. Candidate causes include the pores filling with SEI and plating products, one electrode becoming the limiting factor, and increasing resistance hitting the cutoff voltage early; the classification distinguishes types such as avalanche, latent, and threshold curves, separating six pathways ranging from plating to mechanical deformation.
The practical conclusion for the reader is this: extrapolating the linear slope of the early period to the warranty period overstates the lifespan if a knee point exists. The calculation "2% loss per year, so it will last 20 years" is therefore engineering-wise indefensible.
What Does the Warranty Contract Actually Promise?
The vast majority of manufacturers 8 years/100,000 miles (whichever comes first) offer a battery warranty. GM brands, in addition to this period, put a 70% capacity commitment in place: if the battery drops below 70% within the warranty period, the manufacturer takes responsibility. Hyundai and Kia offer the most ambitious package in the affordable segment with a 10 years/100,000 miles warranty. The fact that some states, led by California, once mandated a 10 years/150,000 miles warranty shows that warranty periods are not entirely a voluntary gesture. When reading the warranty, three questions must be asked together: what is the duration, what is the mileage, and what is the capacity threshold percentage - because a warranty with no specified threshold can effectively exclude capacity loss from coverage.
Ways to Understand How Much Life Is Left in Your Battery
Battery health is expressed by the SoH value, which is the ratio of remaining capacity to original capacity. The methods available to the everyday user, from simplest to deepest, are as follows:
- The "Battery Health / State of Health" menu on the vehicle's screen - some models display the percentage directly.
- Diagnostic scan at an authorized service center - the most reliable official record, especially valuable when buying second-hand.
- Independent monitoring apps - track vehicle data over time and show the trend.
- Indirect indicator: the ratio of the range shown at full charge to the range at the time of purchase.
At a technical level, the picture is richer: a controlled full-discharge capacity test is taken as the reference but is slow; coulomb counting is practical but drifts; incremental analyses such as dQ/dV and dV/dQ - with dV/dQ working better especially on LFP's flat voltage curve - help distinguish the source of capacity loss. Electrochemical impedance spectroscopy points to resistance growth, while the plateau in post-charge voltage relaxation indicates plating.
What Happens When Its Life in the Vehicle Ends: Second Life and Recycling
The word "life" is defined with two different thresholds depending on context. In EV applications, end of service is generally 80% SoH is accepted; stationary storage systems, on the other hand, can operate down to 60-70%. It is modeled that LFP packs could take ~1,600 full cycles or roughly a 35-year scenario to reach 80% SoH in the vehicle - meaning reaching the second-life threshold in an LFP vehicle may be the exception. Severely degraded batteries, however, go straight to recycling instead of a second life. It is estimated that recycling all EV batteries could save ~48.3 MtCO2eq of greenhouse gases by 2050; the battery's life story does not begin and end with the vehicle.
The chemistry landscape will also change in the coming period. Sodium-ion cells are expected to appear in production and in vehicles; despite lower energy density, they offer better performance in extreme heat and cold, and market size forecasts show growth from ~$2.2 billion in 2026 to ~$7 billion in 2034. Solid-state cells, meanwhile, are expected to start appearing in premium applications from 2027 onward. The assessment that solid-state will remain limited until 2035, with lithium-ion remaining dominant in the meantime, is widespread - meaning the degradation mechanisms described on this page will remain on the agenda for many years.
Conclusion: Three Levers That Slow Aging
You cannot stop degradation entirely; you can choose its pace. The two biggest levers on measured impact are temperature and the SoC window: a shaded parking spot, not leaving the battery at 100% charge for long periods, and keeping daily use within the 20-80% band slow both calendar and cycle aging together. Charging C-rate matters far more than discharge rate; a C-rate exceeding the plating threshold costs more than the time it saves. And the fact that the largest DC resistance increase has been observed in cells stored at at least 50% SoC forms the technical basis of the "keep everything in the middle" principle. These three habits, though they may sound ordinary, are the only thing that measurably changes the battery's annual loss.
Sources
- Lithium-Ion Battery Degradation Mechanisms | BatteryMBA
- Battery Degradation: Mechanisms, Causes, and How to Slow It - Wevolver
- EV Battery Health: Key Findings from 22,700 Vehicle Data - Geotab
- A decade of insights: Delving into calendar aging trends - ScienceDirect
- Calendar Aging vs Cycle Aging in LFP Batteries - Sunlith Energy
- LiFePO4 vs NMC Battery Lifespan - Sunlith Energy
- LFP Vs NMC Battery: A Technical Comparison - BSLBATT
- Car Warranty Coverage on an Electric Car Battery - U.S. News
- The Best EV Battery Warranties - CarEdge
- Battery Warranties and Manufacturer Protections - GreenCars
- What Warranty Does An EV Battery Cover - Midtronics
- EV Battery Health: The Essential Guide - Kelley Blue Book
- How Summer Heat Affects EV Battery Range And Charging - Hypercharge
- How Temperature Affects EV Battery Life - XPeng
- Does Temperature Affect Battery Life - Zencar
- Assessing Battery Health When Buying a Used EV - FLO
- How to Check Battery Health When Buying a Used EV - Autotrader
- How to Check EV Battery Health - Electric Car Scheme
- Track EV Battery Health - Recurrent Connect
- How Do Used EVs Hold Up? - CarMax
- Repurposing EV Batteries for Second-Life Storage - ACEEE
- EV battery second-life and recycling pathways - ScienceDirect (Cobb 2026)
- Second-Life EV Battery Market - Circunomics
- What happens to EV batteries at end of life - Electric Vehicle Council AU
- Recycling or Second Use? - PMC (Wesselkämper 2025)
- What Happens to EV Batteries at End of Life - GreenCars
- Next-Generation Batteries 2026+ - Highstar
- Beyond Lithium: New Battery Tech - Yale e360
- Sodium-Ion Battery Market Report - Fortune Business Insights
- Assessing the Promise of Sodium-ion Batteries in 2026 - Volta Foundation
- Review of Cell Level Battery Aging - MDPI (Yarimca 2024)
- LFP longevity discussion - MG EVs forum
- EV Battery Lifespan Explained - Bonnen Batteries
- Battery Ageing and Degradation - Reddit r/electricvehicles
- Calendar Life vs Cycle Life - LinkedIn (Singal)