Why Does Charging Slow Down After 80 Percent?
Share This Page
Charging speed of electric vehicles slows down once 80 percent is reached, because the battery management system gradually limits the current as the cells approach their maximum allowed voltage; this is not a malfunction, but a mechanism designed to protect the cells from overcharging stress. As a result, the last 20 percent can take as long as the first 70, which is why 80 percent is considered a practical stopping point in trip planning.
Highlights
- Hyundai Ioniq 5 completes 10–80% in approximately 18 minutes with its long-range battery; for 80–100%, roughly 32 minutes more is needed.
- During charging, the battery temperature can rise by 10–15°C; the ideal cell temperature is the 20–30°C
- band. At an ambient temperature of 0°C, the battery can take in about 36% less
- energy compared to mild conditions. Reaching 80 percent on DC fast charging typically takes 30–45 minutes.
What Is the Charging Curve and Why Isn't It a Straight Line?
The charging curve is a graph showing the charging power drawn against the battery's state of charge (SoC). It does not proceed at the same power from start to finish, as many drivers expect; variables such as voltage, the cell's internal state, and temperature determine the shape of the curve. The fastest section is typically the 20–60% SoC range; in this window, the cells absorb energy with the lowest resistance.
It is possible to establish the basic logic with an analogy: finding a seat in a full theater is not as easy as sitting down and getting up in an empty one. When the battery is empty, lithium ions find their place in the anode easily; as the state of charge increases, suitable spots become scarce, each new ion settles with more resistance, and this resistance turns into both heat and a voltage rise. In other words, the fuller the battery, the slower it charges - this is not a software preference, but a requirement of electrochemistry.
The CC-CV Logic: Transitioning from Constant Current to Constant Voltage
Almost every lithium-ion battery operates with a two-phase charging strategy. In the first phase, the constant current (CC) phase, the charger holds the current steady near the allowed upper limit and the power curve peaks; statements like "full power up to 60%" describe this phase. When the battery approaches its maximum allowed voltage, the second phase, the constant voltage (CV) phase, begins: the voltage is held constant, the current drops, and charging gradually enters a saturation stage.
There are two physical reasons behind this transition. The first is internal resistance: as SoC rises, the cell's internal resistance increases, and the same current produces more heat and higher voltage. The second is overcharge sensitivity: at high states of charge, lithium-ion cells approach a dangerous reaction threshold, and permanent damage such as unwanted metallic lithium buildup (plating) on the anode can occur. To prevent these risks, the battery management system (BMS) must gradually reduce the current. The start of the taper varies between 75–85% depending on the chemistry and BMS strategy; 80 percent is a general reference point, not a universal threshold.
Let's put it into concrete numbers
Time data best illustrates what the slowdown means. A long-range Hyundai Ioniq 5, in DC fast charging it completes the 10-80% range in about 18 minutes while for the final 20 percent it requires an additional roughly 32 minutes of waiting. In other words, the slowest segment of the charging curve takes nearly twice as long as the fast segment. This reads as follows on a vehicle with about 300 miles (480 km) of range: unplugging at 80% and continuing on your way is far more efficient than waiting for the final 20 percent - in the same time you can cover more than 100 miles of distance on the road ahead of you.
The Power Negotiation Between the Vehicle and the Charging Station
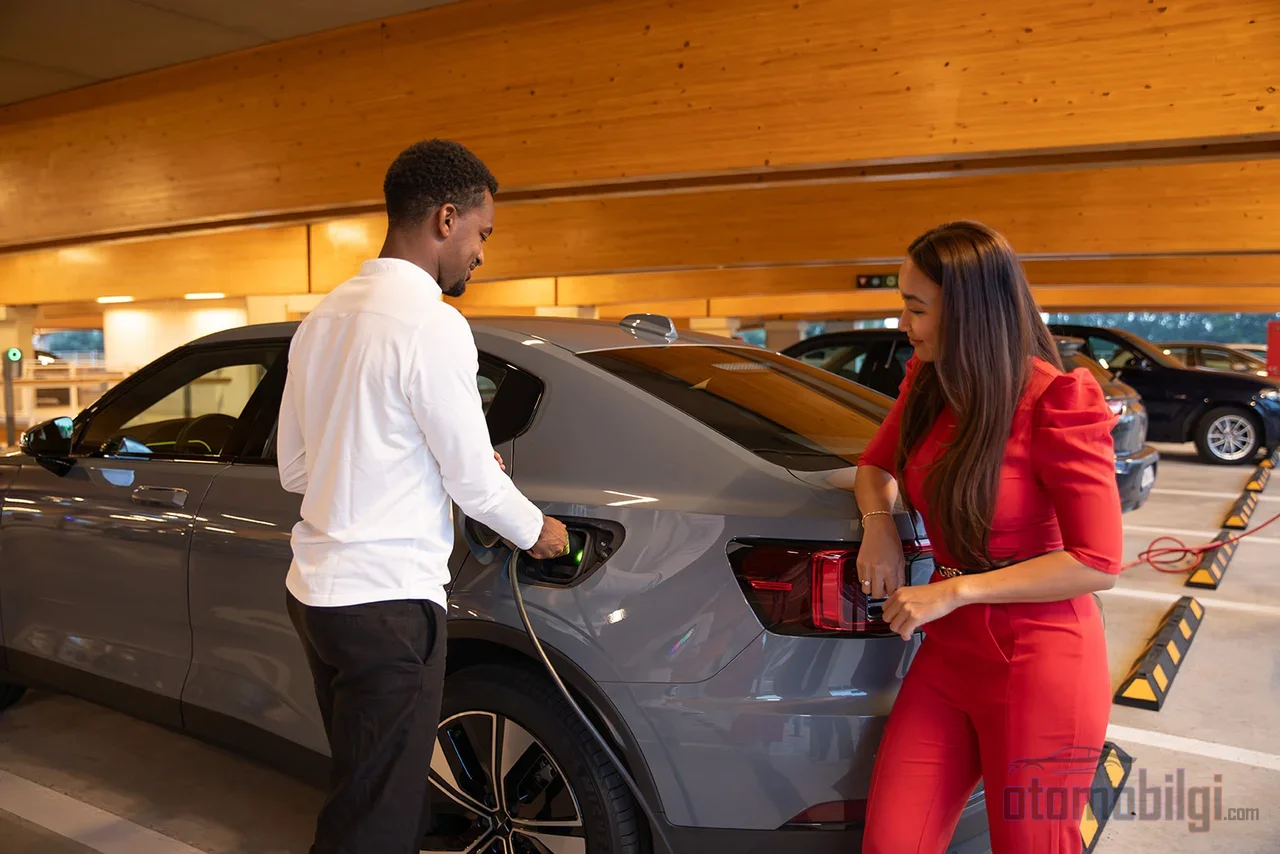
Charging speed is not a one-sided decision; the vehicle and the station carry out a kind of negotiation the moment the plug is inserted. The vehicle reports the current its own battery allows and its instantaneous condition; the station advertises the power it can deliver. The result is always a value below what either side offers: whichever one limits it, the lower capacity is the determining factor. That is why electric vehicles practically never charge at the maximum speed written in their catalogues.
The communication layer is also part of this negotiation. The vehicle and the charger manage the charging session through protocols such as ISO 15118 and OCPP; if the station software is not up to date, the vehicle may not be able to access its full capacity. Also, in shared setups where many vehicles are connected to the same station, the power is split: in a 1 MW installation, two vehicles each receive 350 kW while four vehicles reduce this value to 250 kW and eight vehicles lower it to 125 kW.
Temperature, Age and Other Slowing Factors
It is not only the state of charge that slows the charging curve. The BMS monitors a series of conditions in real time to protect the battery and reduces power when necessary:
- Temperature: The optimal cell temperature band is 20-30°C. In the cold, the chemistry slows down and the battery accepts less energy - at 0°C acceptance can drop by about 36% . In extreme heat, the BMS reduces power to prevent heat buildup; during DC fast charging the internal temperature can already rise by 10-15°C . Battery age:
- As it ages, internal resistance rises; the same current turns into more heat and the BMS begins to throttle the curve more aggressively. Hardware condition:
- Worn or damaged cables and connectors limit the current-carrying capacity. Software restrictions:
- The manufacturer's algorithm can deliberately restrict charging behavior based on cell chemistry. In winter conditions, the most effective solution is preconditioning: when a fast charging point is set as the destination in the navigation, the vehicle heats the battery before setting off, and once the cells approach the ideal temperature it can use the full charging curve. Preheating can increase charging efficiency in cold climates
by up to 30% ; a short drive taken while heading to the charging point helps in a similar way. How Meaningful Is the "Peak Charging Speed" Marketing?
How Meaningful Is the "Peak Charging Speed" Marketing?
The peak power value that manufacturers highlight in their brochures is, on its own, a poor metric. Peak power appears only during the fastest few minutes of the charging curve; the session average is much lower. For example, a model advertised with 250 kW peak power falls noticeably below that in average power over a full charging session. For this reason, for comparison purposes the 10-80% charging times and criteria such as the session average provide far more information than a single peak value.
| Energy received / time over the session | What it tells you | Limitation |
|---|---|---|
| Peak power (kW) | Power at the fastest moment of the curve | Valid only for a brief window |
| 10-80% time | Actual time in a practical journey scenario | Does not reflect peak power |
| Average charging power | Energy delivered over the session / duration | Usually not shared in catalogs |
A concrete comparison: in one publisher's measurement, the Ioniq 5, completed the 10-80% range the Tesla Model 3 about 9-11 minutes faster; the Model 3s in question 24-26 minutes were in the range. The Ioniq 5's 800V architecture carries the same power levels with less current, producing less heat and loss; this is the foundation of its ability to keep the curve steep for longer even at a high state of charge. Architecture does not eliminate the taper - it simply pulls the entire curve upward.
The 80 Percent Rule: Speed, Battery Life, or Both?
Stopping at 80 percent is not based on a single justification; it delivers two separate benefits at once. The first is time: waiting after the taper has started is inefficient in terms of energy received per minute. The second is battery health: repeatedly reaching 100 percent with DC fast charging subjects the cells to high voltage stress and accelerates capacity loss in the long run. Batteries do not like being full - just like phones and cordless drills. That is why both Tesla and Hyundai recommend an 80% charge for daily use.
This should be read not as a rule but as a good default. Batteries with LFP chemistry, thanks to their different voltage profiles, up to about 90% can sustain high charge rates; the taper starting point also varies from model to model, 75-85% between. Reaching 100 percent is not a problem if done occasionally before a long trip - as long as it does not become a daily routine. One final distinction: with AC charging (home charging), the power is already low, so the taper is so slight that it is practically unnoticeable. The slowdown creates a dramatic experience only with DC fast charging.
Is the Slowdown a Fault? When Should You Be Suspicious?
The slowdown after 80% is a protection mechanism by design; if the vehicle is not faulty, this is the expected behavior. The real question to ask is whether other parts of the curve are slower than expected. The fastest range, 20-60%, band are significantly below peak power, there is a factor independent of taper at play: a cold battery, outdated station software, shared power, a worn cable, or battery aging. If preconditioning was done before charging and the temperature is suitable, failing to reach the expected peak is a signal worth evaluating.
The bottleneck itself is gradually shrinking thanks to technology. 800V platforms carry higher power with fewer losses; advanced thermal management and adaptive BMS algorithms optimize voltage, current, and cooling in real time; solid-state batteries promise better thermal stability at high states of charge. These will not eliminate taper - physics dictates that it is here to stay - but they can significantly reduce the time cost of the CV phase compared to today.
The practical takeaway is brief: end fast charging sessions around 80%, occasionally go up to 100% when needed before a long trip, precondition the battery in winter, and when comparing vehicles look not at peak power but at 10-80% times . A driver who reads the charging curve correctly saves both time and extends their battery's lifespan.
Sources
- The 80% rule: Why you shouldn't charge your EV to 100%
- Why does EV charging slow down after 80%?
- Why Do EVs Charge So Slowly?
- Why Is My Car Charging So Slow? Top Reasons and Solutions
- Battery Charging and Charging Performance
- EV charging curve: Why charging speed fluctuates
- Edmunds EV Charging Test: How fast does each EV charge?
- Tesla Model 3 LR Vs Hyundai Ioniq 5: Fast Charging
- What Your EV Charging Time Calculator Doesn't Tell You
- Understanding the Charging Curve and the 80% Rule
- Five tips for charging electric vehicles in cold weather