How Does Telemetry Give Teams an Advantage in GT Racing?
Share This Page
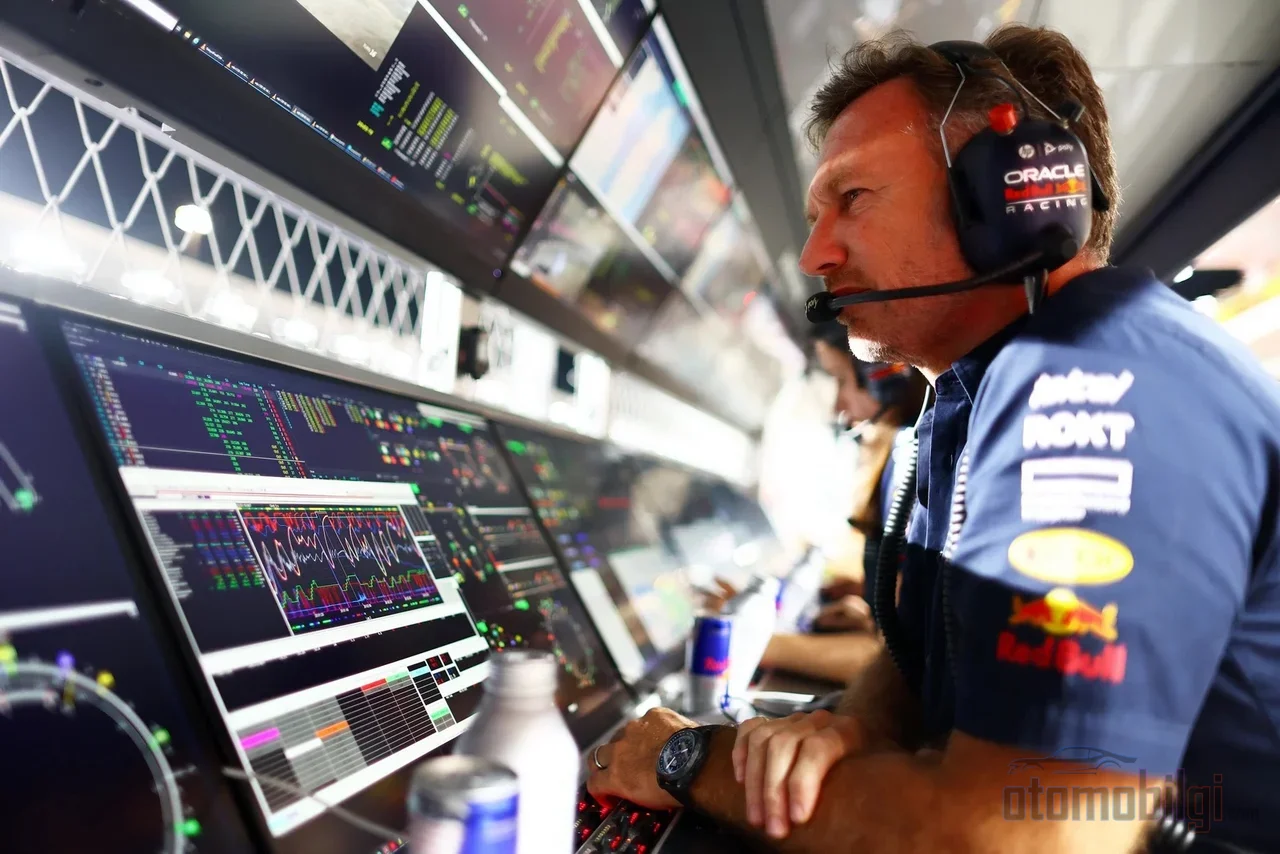
In GT racing the cars are almost identical to one another; so why do some teams still finish ahead every time? The answer usually lies not in engine power or wing angle, but in how telemetry data is collected and interpreted correctly. Because the Balance of Performance (BoP) system in the GT3 field brings the cars so close together, the final difference that wins races shows up on the computer screens on the pit wall. In this article I explain how the data is read, from braking points to throttle traces, how amateur drivers are developed in pro-am lineups, and why no two laps are read the same way.
Highlights
- BoP was born in 2005 alongside the GT3 category and remains the class's fundamental pillar
- Telemetry data is collected in five main groups: driver inputs, vehicle motion, chassis, tire/brake and engine data
- A time delta map can often narrow down the total loss to just two or three corners
- In amateur and Pro-Am drivers, the gains from data analysis come earliest and are the biggest
- The global racing telemetry market is expected to grow from $579.5 million in 2025 to $1.48 billion in 2035
What Is Telemetry and What Do GT Teams Look At?
Telemetry is the data that streams wirelessly and in real time from the car to the pit wall: speed, throttle, brake, engine health, tire pressure... Alongside it there is also data logging, that is, data recording. That writes the same information to the memory of the recorder inside the car; when the car returns to the pits, engineers download it to a computer and go through it gradually between sessions. Live telemetry is used mostly to monitor the car's health and support strategy, while detailed lap analysis is usually done with recorded data. In short, one is a live broadcast and the other is a recording - together they make up the team's wisdom.
So what is actually being recorded? Grouping the data into five categories makes the job easier:
- Driver inputs: throttle position, brake pressure, steering angle, gear
- Vehicle motion: speed, GPS position, lateral and longitudinal g-force
- Chassis: damper travel, ride height, wheel speeds
- Tires and brakes: temperature and pressure channels
- Engine and systems: RPM, oil pressure, water temperature, fuel
Sensors record these dozens of channels many times per second. Imagine: you don't even remember what you did entering a corner, but the car forgets nothing. The engineers' job is precisely to read that memory.
If BoP Equalizes Everything, What Are the Racers Actually Winning?
Balance of Performance is the equalization mechanism that brings cars from different manufacturers close to one another over a lap. It was born in 2005 with the GT3 category, and today it is what keeps the competition of GT3 series around the world alive. A similar logic operates in GT4 as well; there, BoP narrows the gaps between manufacturers and leaves the result to the execution of the driver and team. When the hardware is equal, what determines the order? Setup, driver consistency, tire management, strategy and of course data. So the idea that BoP makes development meaningless is a wrong conclusion; it just moves the advantage somewhere else.
To make this concrete, you can look at single-make series. In the Porsche Carrera Cup North America, everyone races with the same car; the hardware is completely equal. So what makes the winner? A few meters of braking difference, a few mph of corner exit speed... Only data reveals these small details. In series with BoP, the picture is the same: among equal cars, what creates the difference is the analysis at the pit wall.
Collect, Compare, Apply: How Data Saves Time?
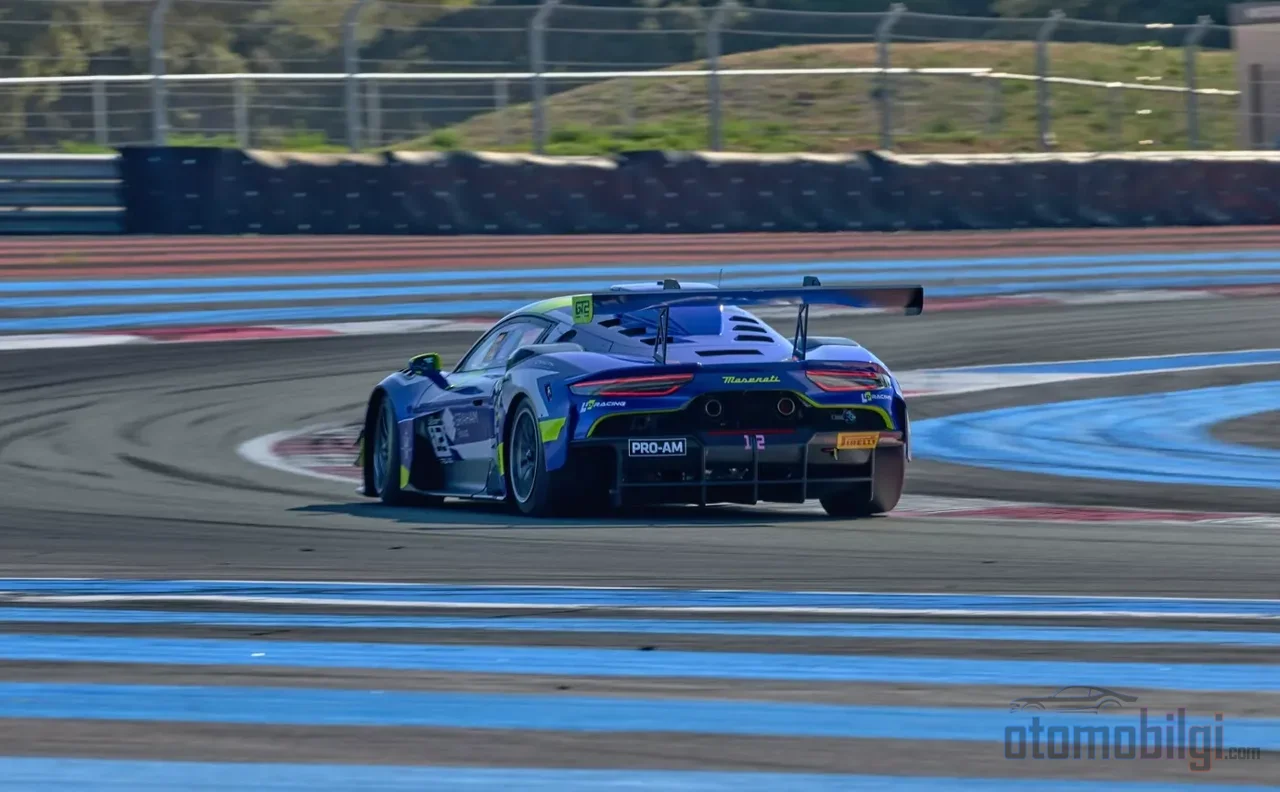
Analysis works as a three-stage cycle. First, data is recorded in every session; then laps are overlaid and compared - the fastest lap, the average lap, a teammate's lap, or a reference lap; finally, a prioritized list of changes is applied. A simple but incredibly effective setup. In the next section, let's look at how this comparison appears on screens.
Brake trace, throttle trace, and time delta
When engineers open a lap, the first thing they usually look at is the time delta: a map of the difference between two laps along the track. If you are losing three tenths in total, this can often be narrowed down to two or three corners - so you can think of it as a heat map showing where you made mistakes. Then the traces come into play. The speed trace is the basic reference. The brake trace shows how quickly the brake is applied, whether peak pressure is maintained, and how it is released; the trace of progressive release, i.e. trail braking, is visible here. Braking zones are where the most time is gained or lost over the shortest distance on track, so driver coaching always starts here too. The throttle trace tells how quickly and smoothly full throttle is applied at corner exit; how the exit speed carries into the next straight is read from here as well. There is also the friction circle: when lateral and longitudinal g-forces are plotted, how fully the driver uses the tire in a corner becomes clear.
One more technical detail: when comparing two laps, the graphs are plotted against distance as standard; this way, braking points and turn-in points align at the same position on both lines. Time-based plots are used for tasks like stint analysis. It may seem like a small detail, but the difference between an engineer looking at the wrong axis and one looking at the right axis can be the difference between the podium and mid-field.
Is the problem with the driver or the car?
Perhaps the coolest ability of data is diagnosis. If sudden brake release or early turn-in is seen at corner entry, the understeer is driver-induced; if the inputs match the reference driver yet the understeer persists, the culprit is the setup. Oversteer at corner exit usually stems from sharp throttle application; if it appears even with soft inputs, then the car is speaking. If lap times are dropping over a stint and inputs are inconsistent, the cause is the driver; if tire temperatures have fallen outside the window, the cause is the car. Of course, for the comparison to be valid, the laps have to be comparable: same car, same setup, same tire compound, similar fuel range, and identical assist settings. Otherwise you end up comparing apples and oranges.
How Do Amateur Drivers in Pro-Am Rosters Improve with Data?
The pro-am model beats at the heart of the GT world: one professional and one (or more) amateur driver share the same car. GT3 cars are designed for this mixed use from the ground up; GT4, on the other hand, is a class aimed entirely at amateurs, closer to production and more affordable. In this setup, data analysis is the amateur driver's most valuable coach. Because at the amateur and Pro-Am level, there is still plenty of lap time to be lost, and the data points directly to where: which braking point is too early, at which exit throttle application came too late. It also dramatically speeds up learning a new car or track; it makes limited track time productive. Beginners find their biggest gains early, usually in just a handful of braking zones and corner exits; for experienced drivers, the margins shrink to hundredths of a second and the analysis has to go much deeper.
In Pro-Am endurance race training, video and telemetry are examined side by side, and the driver is told clearly where to speed up. By looking at throttle traces and brake pressure traces, it is even possible to identify slow drivers in the field; brake pressure, throttle position, and wheel speed are compared in specific corners. The one thing I want to underline here is consistency: a driver who can repeat a strong lap time throughout the race usually beats a driver who sets one fast lap and then drops off. It sounds simple, but that is exactly why it is the most important gain.
Why Does the First Brake Lap Read Differently from a Race Lap?
Ask yourself this: can your braking points on the first lap of practice be the same as those on lap 40 of the race? They cannot. And the data shows this mercilessly. During practice, the driver gets to know the track and the car; with every lap the limits change, braking points move later, throttle applications become more aggressive. In the race, the picture changes completely: tires wear, their temperatures are kept within the window, fuel weight decreases, and the driver has to work through traffic. That is why engineers never read a practice lap with the same eye as a race lap; they look at it on a stint-by-stint basis. During the race, live telemetry monitors vehicle health, and stint-based tire and pace tracking guides the strategy.
The role of data also changes over the course of the weekend. Before the event, engineers use past data to establish a baseline setup and targets; during practice, changes are applied one by one. In qualifying sessions, tire preparation is worth as much as the lap itself in determining the single-lap grid position - setting the best lap is not enough, you have to set it at exactly the right moment. Factory engineers see race weekend data as a validation tool; the real learning happens in tests and structured processes. So data is present at every stage, but it does a different job at each one.
Data and Strategy in Endurance Racing
In 24-hour races, the role of data moves to a whole different dimension. The 79th at Spa: CrowdStrike 24 Hours of Spa was run on June 27-28, 2026, with the grid set through sessions such as Superpole 2. The 2026 edition at Daytona was run between January 16-18 on the 5.729-kilometre oval-roval circuit; classics like the Nürburgring and Bathurst are also part of the same endurance culture. In these races, there are dozens of hours of changing tyre, fuel and driver combinations in every stint. How consistent each driver is under which conditions, how each car manages its tyres - it is all recorded in the data, and strategy is read precisely from this picture. But can the fate of a race, with driver changes, night running and traffic, hinge on an analytical difference of a few hundredths of a second? That is perhaps the most beautiful unanswered question of endurance racing; but the team on the pit wall knows very well that a team that does not read the data has slim odds on that dice roll.
Another sign that this world is growing is the market itself. The global racing telemetry market is expected to grow from a volume of $579.5 million in 2025 to $1,489.5 million by 2035, at an annual growth rate of 9.9%. Thanks to IoT sensors and cloud platforms, telemetry is now reaching beyond professional pit walls - meaning the day when you too will stack and examine your own laps in sim racing is not far off. In fact, in the sim racing community, reading speed traces, deltas and brake traces are now among standard skills.
Is Learning Telemetry Hard, and How Much Does It Gain You?
This is one of the most frequently asked questions. Reading your speed trace, time delta, brake and throttle traces is accessible enough to be learned in a few guided sessions. The real long-term work is diagnosing causes and separating whether the problem lies with the driver or the car - and this is exactly where the value of an experienced race engineer emerges. You can also analyse your own data yourself; at a basic level, definitely yes. But there is a limit to your own analysis: it shows what happened, but not always why. When you are both driver and analyst at the same time, it is hard to separate a technical issue from a driving error.
As for the question of how many seconds it gains you... let us be honest: there is no universal number. The gain depends on the driver's stage of development, familiarity with the car and track, and preparation. I suggest you approach anyone who promises you a single magic number with suspicion. But I can say this: the cheapest performance gain in a BoP field probably comes from spending a few hours in front of the screen on the pit wall. When you watch the next race, I say keep an eye on the pit wall too - the real race may be unfolding on that screen.
Sources
- Race Data Analysis Explained: Telemetry to Lap Time Gains
- How Data Analysis Transforms F1 Race Performance
- Racing Telemetry Market Size, Share | CAGR of 9.9%
- Chat GT3: Who Created Balance of Performance?
- Balance of performance
- Group GT3
- What Are the Differences Between GT3, GT2, and GT4 Cars?
- 24 Hours of Spa 2026: Race Update
- The Key To Driver Training | Pro-Am Endurance Racing