4 Liters in the WLTP Lab, 6 on the Road: Where Does This Difference Come From?
Share This Page
A gasoline car that consumes 4 liters in the WLTP laboratory may burn 6 liters on the road; this difference does not mean the vehicle is faulty. The catalog value is a comparison reference measured under standardized and repeatable conditions, while real pump consumption is the result of field conditions encompassing air conditioning, load, traffic, and driving style all together. The gap between the two is typically 10 to 16 percent for gasoline cars and around 3 to 10 percent for diesels, and where this difference comes from is quite well defined from an engineering standpoint.
Highlights
- The WLTP cycle lasts about 30 minutes and covers 23 km of distance; this is a small sample of real-world use.
- The average difference between WLTP and real consumption in gasoline passenger cars is around 16%, and in diesels 10% .
- Aggressive driving can increase consumption in stop-and-go traffic by up to 40% .
- WLTP reduced the deviation of up to 50% in the old NEDC cycle to about 14% but did not eliminate it.
- With eco-driving techniques, fuel savings in the 10-30% range are possible.
How Is the WLTP Test Actually Conducted?
WLTP is a global test procedure published in 2014. The car runs on a dynamometer that turns the wheels while the vehicle stands still in the laboratory. The cycle is derived from real driving data; it includes acceleration, braking, and stops. But there is a critical point here: The test does not simulate the real world. It produces a set of controlled, repeatable, and reproducible conditions. The aim is to be able to measure two cars with the same yardstick; it is not to guarantee absolute real-world consumption.
The cycle is divided into four speed sections: In the Low section, speeds reach 56.6 km/h, in Medium 76.6 km/h, in High 97.4 km/h, and in Extra High up to 131.3 km/h. The ambient temperature is by default 23 °C. The procedure even defines gear shift points, total vehicle mass, fuel quality, and tire selection and pressure. Standardization at this level guarantees the repeatability of the measurement; however, everything that is not defined - that is, the rest of real life - becomes the source of the difference.
Engineering Sources of the Difference: What Is in the Laboratory and What Is Missing on the Road?
The fundamental reason for the consumption difference is the inconsistency between the assumptions of the laboratory procedure and the conditions of real driving. This inconsistency can be examined in three layers.
Road load measurement and coastdown tolerances
The resistance to be applied to the vehicle on the dynamometer (rolling resistance plus air resistance) is determined through coastdown tests conducted on the road. The vehicle is released from a certain speed, and road load coefficients are calculated from the deceleration curve. However, the effect of parameters such as temperature is significant in this measurement: Accepting 20 °C instead of a reference ambient temperature of 14 °C , along with additional tolerances on the dynamometer, contributes directly to the CO2 difference. According to the SAE J1263 standard, the coastdown ambient temperature is 5-35 °C must be within this range; data outside this range cannot be reliably corrected. In other words, even the resistance values in your catalog are the product of an idealized atmosphere.
Warm-up condition
Short warm-up periods or long waits before coastdown produce high start-up losses in the measurement; these are usually filtered out by correction algorithms. On the road, however, you face exactly the opposite problem: every journey that begins with a cold engine pays the bill of the engine oil, coolant, and catalytic converter not reaching full efficiency, plus the extra fuel wasted.
Everything that is not in the laboratory
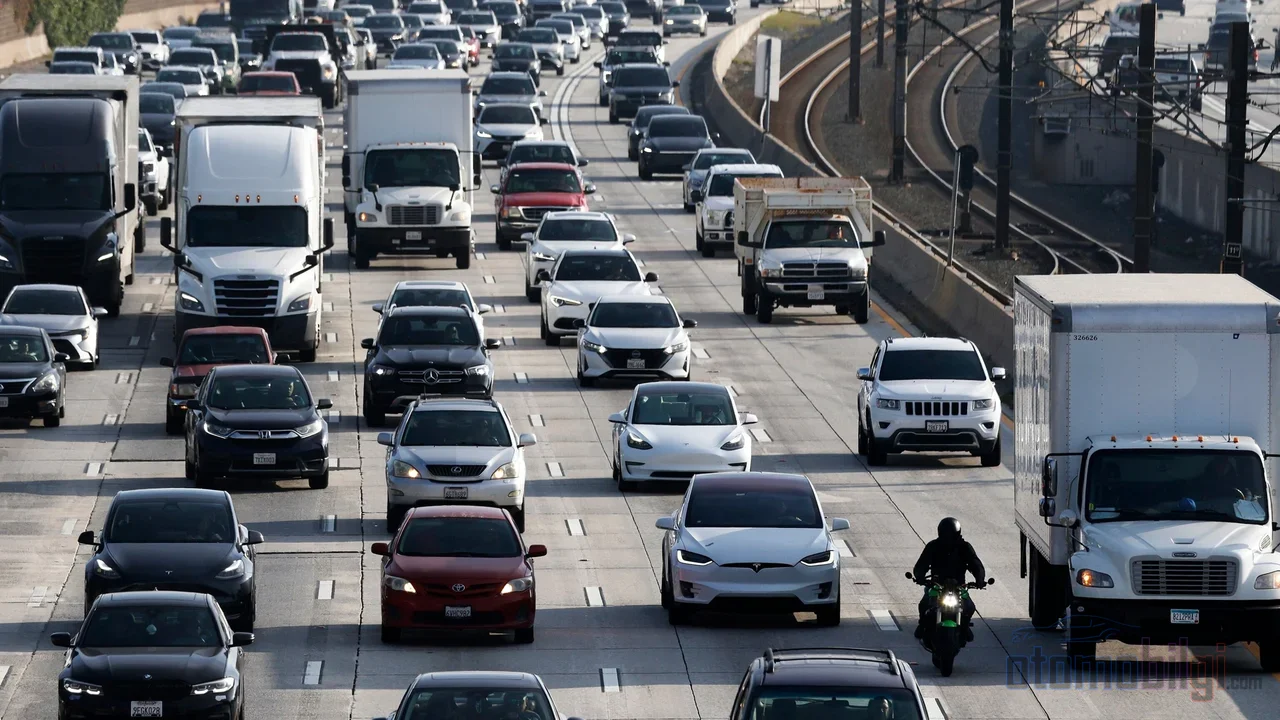
The load of the air conditioning compressor, unnecessary cargo in the trunk, climbs, wind, rain and traffic - none of these exist in the WLTP cycle. The test offers a controlled, light and repeatable micro-universe; you drive in the sum of variables.
Usage Conditions That Widen the Gap: Where Do We Deviate?
Even if they accept the laboratory conditions, no vehicle lives at its catalog value. The main usage factors that widen the deviation are measurably clear:
- Extremely short trips: The journey ends before the engine and catalytic converter fully warm up; this produces noticeably higher consumption compared to medium-distance travel.
- Aggressive driving: Frequent acceleration and hard braking can increase consumption by approximately 40% ; on the highway 15-30%, and in stop-and-go traffic 40% up to economy loss.
- Extremely cold weather and heavy traffic: Both raise consumption; optimizing traffic flow (for example, reducing the number of unnecessary signal waits) lowers emissions and consumption.
- Unnecessary load: Every unused item you carry in the trunk is a mass penalty paid at every meter.
The scale is striking too: consumption measured in the old NEDC cycle could come out up to 50% lower than under real conditions. WLTP reduced this gap to approximately 14% from 40%- meaning the procedure improved significantly, but it is not perfect. Moreover, the Netherlands' 2024 real-world consumption data shows that the gap for gasoline vehicles has been growing again since 2022. This trend is a reflection not of the test procedure, but of the gap between the equipment added to vehicles and real usage.
Why Is the Deviation Different in Size for Gasoline, Diesel and LPG?
The gap is not the same size across the three fuel types; because each one's efficiency profile responds differently to different conditions.
| Fuel | WLTP-real gap (typical range) | Why it differs |
|---|---|---|
| Gasoline | 6.9% - 16% | Sensitive to the urban cycle; high cold-start and short-trip penalty |
| Diesel | 3.2% - 10% | Efficient over long distances; the absolute CO2 gap is high but the percentage gap is low |
| LPG | 10-15% higher volumetric consumption compared to the gasoline equivalent | LPG has a lower energy density |
The reason for the two-digit gap here is a difference in definition: CO2-based measurements and liter-based consumption measurements scan different populations and different periods. Diesel's absolute real-world CO2 gap comes out higher than gasoline's; on the other hand, in some data sets the percentage WLTP deviation is higher for gasoline vehicles. The two statements do not contradict each other - one is absolute, the other is relative.
With LPG the picture is more nuanced. Consumption per unit volume is 10-15% higher than the gasoline equivalent; this is a physical consequence of energy density and there is no escaping it. However, energy-based comparisons made under real driving conditions show that the energy spent per unit distance with LPG can be close to, or in some studies even lower than, that of gasoline. LPG also burns cleaner than gasoline and diesel; most gasoline vehicles can be converted to dual-fuel operation. When evaluating the consumption impact of conversion, it is essential to clarify the unit of measurement: liters or megajoules?
How Close Can a Driver Get to the Catalog Value?
The exact answer lies in the usage profile. A driver who mainly drives long distances at constant speed is already the profile closest to WLTP's assumptions; getting within a few percentage points of the catalog value with a diesel vehicle is a reasonable goal. For urban, short-distance use, what should be aimed for is not the catalog value but the best possible value for that profile. Eco-driving techniques 10-30% or more savings can be achieved - while this does not close the entire gap, it means you can largely manage the driver-controllable portion of the gap.
The practical approach strategies are:
- Gentle acceleration, steady speed and reading traffic ahead; coasting when slowing down.
- Correct tire pressure and regular maintenance; engine oil at the viscosity recommended by the manufacturer alone provides 1-2% improvement.
- Avoiding unnecessary weight and unnecessary idling.
Tracking the measurements on your own side is also part of the strategy: average consumption values captured on the same route under similar weather conditions quantify the gap between the catalog and your reality. Data instead of guesswork.
Common Misconceptions About Fuel Consumption
The most frustrating thing in the effort to close the gap is energy being spent in the wrong directions. Let us clear up a few common beliefs:
- The idling myth: Waiting at idle to warm up the vehicle is unnecessary; restarting the engine burns less fuel than waiting.
- Neutral gear: Rolling in neutral does not save fuel; modern injection logic does not compensate for it anyway.
- Air conditioning: Air conditioning affects fuel consumption less than thought; above 55 mph (approximately 90 km/h) turning off the air conditioning and opening the windows may not save anything due to increased aerodynamic drag.
- Premium fuel: For most vehicles, premium gasoline provides no extra efficiency.
- Overinflated tires: It does not measurably improve consumption; it reduces grip.
If the Catalog Says 4 Liters, When Is 6 Liters Normal?
Let us make it concrete. An average deviation of 16% turns a WLTP value of 4 liters in a gasoline vehicle into 4.6 liters approximately. The remaining 1.4-liter margin belongs to usage conditions: short trips, air conditioning, winter temperatures, traffic and driving style. Aggressive use enlarges this margin even further; prudent use shrinks it. In other words, "4 in the catalog, 6 at the pump" is not a sign of a fault, but a typical manifestation of the known and quantified difference between laboratory conditions and real life. The size of the gap is explained less by the vehicle itself and more by your profile.
As a final note: it should be remembered that the purpose of the test procedure is comparison between vehicles. When comparing two cars in a showroom, WLTP is still the most consistent yardstick we have. If you are looking for a contractual real-world consumption guarantee, you need to measure not the yardstick but your own usage profile.
Sources
- Worldwide Harmonized Light Duty Vehicles Test Procedure
- What is WLTP? An EV Driver's Guide to Consumption and Emissions
- WLTP: What is the Purpose of Lab Tests for Cars?
- Real-World Fuel Consumption and Energy Consumption of Passenger Cars in the Netherlands 2024
- On the Way to 'Real-World' CO2 - ICCT EU WLTP Report
- The Impact of Official Versus Real-World Road Loads on CO2
- Which Factor Contributes More to the Fuel Consumption Gap
- Gap Between On-Road and Official Fuel Efficiency
- Comparison of Fuel Consumption in WLTP and NEDC Procedures
- Comparison of Energy Consumption Between Gasoline95 and LPG Under Real Driving Conditions
- Fuel-Efficient Driving Techniques
- Efficient Driving to Conserve Fuel
- Eco Driving
- Fuel-Efficient Driving Techniques
- SAE J1263 Coastdown Standard
- Some Common Myths: Be Idle Free
- What is LPG and Should I Convert to It?