What Is C-Rate and What Does It Measure in a Battery?
Share This Page
C-rate is a technical unit that measures a battery's charge and discharge rate, normalized against its nominal capacity. A value of 1C means the battery is fully charged and discharged in 1 hour; 2C shortens this to 30 minutes, while 0.5C extends it to 2 hours. Because it makes cells of different sizes comparable regardless of their capacity, it is the common language of battery engineering.
Highlights
- 1C means the battery is charged or discharged at its full capacity in 1 hour: For a 10 Ah cell, that means 10 A of current.
- Heat generation increases with the square of the current: At a 30 °C ambient temperature, 1C discharge produces about 0.18 W of heat, while 4C discharge produces about 2.5 W.
- Fast charging shortens lifespan through lithium plating and SEI growth, especially at low temperatures.
- NMC cells offer high energy density, while LFP cells offer longer cycle life and thermal safety.
- Manufacturer datasheets specify continuous and peak (pulse) C-rate values separately; the difference between the two is critical in marketing claims.
What Exactly Does C-Rate Mean?
Amps alone are not enough to express how fast a battery charges and discharges, because what is a chasm for a small cell is a elephant's step for a large pack. C-rate solves this problem by relating current to capacity. The formula is simple: current (A) = C-rate × capacity (Ah). The duration is found with the equation t = 1/C; discharge at 0.2C takes five hours, discharge at 5C takes twelve minutes.
Let's reinforce it with numbers. If 1C is applied to a cell with 10 Ah capacity, the current is 10 A and the cell discharges in one hour. 5C means 50 A and reduces the discharge time to 12 minutes; 0.1C, on the other hand, provides a 10-hour discharge at 1 A of current. The same logic applies when 100 mA is applied to a small 500 mAh cell: the result is again 0.2C. That is why C-rate is a scale-independent speed indicator.
What Ranges Do the Values Take in Real-World Applications?
Different use cases operate in different rate regimes. A power tool discharges at around 5C, a drone at about 2C; an EV battery is typically in the 0.5C band. Grid-scale energy storage goes as low as 0.1C, while laptop cells operate at a calm rate like 0.05C. Lead-acid batteries are usually rated at 0.05C or 0.2C; li-ion energy cells cannot be discharged above 1C due to protection circuits, while power cells can tolerate up to 10C. At the extreme end, jump starter devices perform short-term discharges of up to 80C, and the RC industry requires rates of up to 50C.
Does a High C-Rate Harm the Battery?
Short answer: it is not the speed itself that is harmful, but the side effects of speed. When high current is drawn from a li-ion cell, losses occur across the internal resistance, and these losses turn into heat. The critical point is that heating is not linear with current but proportional to the square of the current (q = I²R). Quadrupling the current increases the heat roughly sixteenfold. Manufacturer data concretizes this scale: At 1C discharge in a 30 °C environment, approximately 0.18 W of heat is generated, while the same cell generates approximately 2.5 W at 4C.
Beyond heat, a chemical mechanism comes into play: lithium plating. As charging speed increases, lithium ions accumulate on the anode surface as metallic lithium without being able to enter the anode. This accumulation both permanently consumes active lithium and degrades the anode's surface, increasing internal resistance. The same conditions also accelerate the unwanted thickening of the protective SEI layer on the anode surface. Low temperature makes this picture even worse: since ion movement has already slowed in cold cells, high C-rate charging significantly raises the plating risk.
The result manifests itself in measurable ways. On the efficiency side, a cell's total charge-discharge cycle efficiency is approximately 86% at 0.2C, while it can drop to approximately 75% at 1C. Capacity readings are also affected by speed: a cell discharged at 2C delivers only approximately 95% of its label capacity, whereas at 0.5C the reading can exceed 100%. Thermally, the split is also clear: above 1C, ohmic (resistance-related) heat becomes dominant, while at rates below 1C, reversible, entropy-related heat prevails.
Does Fast Charging Shorten EV Battery Life?
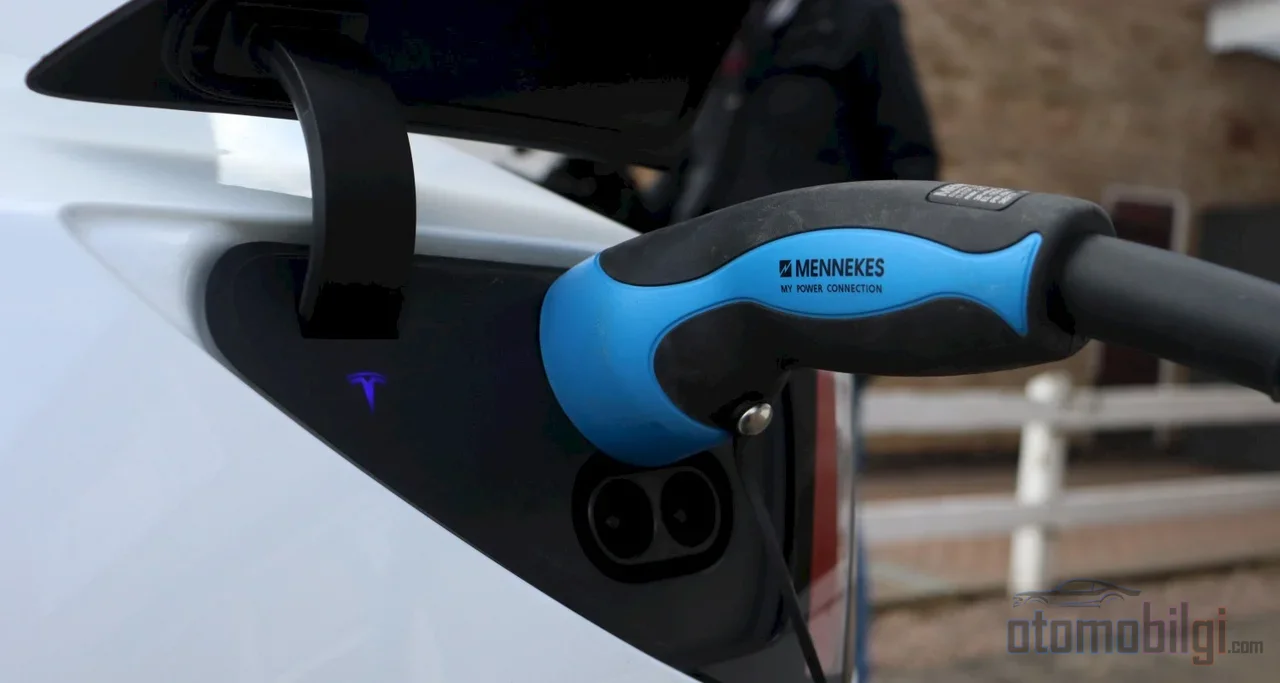
This is the most debated question of the 2025–2026 period, and the consensus cannot be summed up in a single sentence. According to a large-scale fleet telemetry analysis, vehicles that heavily used conditioned DC fast charging above 100 kW showed an average annual capacity loss of up to 3.0%; this is a notably higher rate compared to vehicles operating with slow charging. The picture is consistent on the academic side as well: fast charging shortens cycle life in all major BEV chemistry families, including NCA and NMC. Frequent DC fast charging is estimated to typically cause an additional 5–10% capacity loss over the battery's lifetime.
However, the picture is not one-dimensional. Fast AC charging up to 22 kW causes no measurable harm to the EV battery, as long as other habits are good. Occasional DC fast charging is estimated to add only approximately 0.1% additional loss per year; it is emphasized that chemistry and the overall usage pattern are the determining factors. At the extreme end, the limits are clear: charging rates above 4C can alter the cell's chemical structure, causing serious damage. The practical conclusion is that fast charging is manageable as an emergency and travel tool when used reasonably, but becomes a habit with increasing costs when it becomes part of the daily routine.
NMC or LFP: How Does Cell Chemistry Respond to Speed?
The same C-rate produces different results in different chemistries. NMC cells offer more energy per kg, have better cold weather performance, and stand out with power capabilities that can reach continuous discharge bands of 3–7C. LFP positions itself with a longer cycle life, better thermal safety, lower cost, and containing no cobalt. The trade-off is clear: a choice is made between energy density and lifespan, safety, and cost; there is no general rule as to which one is absolutely better.
The difference on the degradation side can be traced with numbers. While NMC cells can lose capacity 40–50% faster than their label value, in LFP this range stays at 20–30%. LFP packs can retain about 85% of the cell-level energy densities at pack level. LFP's weak point is cold: it handles heat better than NMC but struggles at low temperatures. Application choice is also shaped by this balance; NMC dominates in performance- and range-prioritized segments, while LFP prevails in safety-, lifespan- and cost-prioritized fleet, bus and marine applications. There is also a datasheet practice: LFP manufacturers specify a maximum continuous charge C-rate lower than the discharge limit, meaning charge rate is more tightly restricted than discharge in most chemistries.
| Feature | NMC | LFP |
|---|---|---|
| Energy density | Higher | Lower |
| Cycle life | Shorter | Longer |
| Thermal safety | Moderate | Better |
| Cold weather performance | Better | Struggles |
| Cost | Higher | Lower |
| Capacity loss band | Up to 40–50% | 20–30% |
How to Read Continuous and Peak C-Rate on Data Sheets?
Every cell data sheet carries two separate discharge values: continuous and peak. The continuous value is the current the cell can deliver indefinitely without overheating; the peak value applies only to pulses lasting a few seconds. Since a cell can be discharged faster than it can be safely charged, large differences are seen between these two figures. For example, most manufacturers' maximum continuous discharge current is in the 1C band.
Real cell examples show how this distinction is to be read. A 21700 power cell with 5.0 Ah capacity can offer 20 A continuous and pulse discharge above 20 A, with fast charge tolerance exceeding 3C. Another 21700 variant can reach up to 45 A continuous discharge and 3C fast charge; a model in the 18650 format can deliver up to 100 W of power and retains 75% of its capacity after 500 cycles. The role of low internal resistance is also concrete: an internal resistance at around 13 mΩ reduces I²R losses, directly lowering heat buildup. On this basis, manufacturers can announce claims of below 10 minutes charging at up to 5C.
There is a marketing practice the reader should be careful about here: some products may carry C-rate claims above 50C based only on a maximum pulse discharge lasting a few seconds. Unless confused with the continuous value, this figure is not misleading, but to understand real usage time, one should always refer to the continuous value. The capacity rating rate is also a separate detail: capacities are usually measured and labeled at a 1C rate; lead-acid and alkaline cells use much slower rates such as 0.05C.
Which C-Rate and Charge Range Is Suitable for Long Life?
For energy-focused li-ion cells, the recommended charge rate is in the 0.5C–1C range; at this speed, a full charge takes about 2-3 hours. Slower charging reduces heat, lowers the risk of plating, and slows SEI growth. On the voltage side, a relatively modest charge limit of 3.92 V per cell is shown to be the optimal point for longevity, and this approach is calculated to extend the expected life of an EV li-ion battery by 44-130%.
The second lever is the charging range. Keeping the cell within the 20-80% SOC band minimizes the mechanical and chemical stress that both very full and very empty states create inside the cell. To summarize in C-rate terms: keep charging below 1C, stay around 0.5C if possible, save DC fast charging for travel needs, and adopt a partial charging routine for daily use. These three rules complement each other; none of them alone substitutes for the others.
Conclusion: Speed Is a Trade-off
C-rate is an elegant measurement that reduces the battery's speed to a single number, but that number is not free of cost. A high C-rate multiplies heat per the I²R law, accelerates lithium plating and SEI growth, and reduces efficiency and measured capacity. The choice of chemistry draws the boundaries of this trade-off: NMC prioritizes speed and energy density, LFP prioritizes longevity and safety. The right way to read it is also simple: look at the continuous value on the datasheet, evaluate charging speed separately from the discharge limit, and save fast charging for when you need it.
Sources
- What is a Battery C-Rate? Definition and Calculations
- What C-Rate Really Means for Lithium-Ion Performance
- What is a Battery C Rating?
- BU-402: What Is C-rate?
- Investigation on lithium-ion battery degradation induced by fast charging
- The Dilemma of C-Rate and Cycle Life for Lithium-Ion Batteries
- Study on Lithium-Ion Battery Degradation Caused by Side Reactions
- Decoupling the thermal and non-thermal effects of C-rate
- Battery Max Continuous Discharge Rating Explained
- LFP vs NMC Battery Chemistry for OEM Packs
- LFP vs NMC: Technical Comparison of Cycle Life
- EV Battery Health Study
- How does fast charging affect EV battery lifespan?
- Impact of Charging Rates on Electric Vehicle Battery Life
- BU-808: How to Prolong Lithium-based Batteries