What Is a Good kWh/100 km Figure? Reading Your Electric Vehicle's Consumption
Share This Page
Short answer: as of 2026, in real-world use, consumption of around 16 kWh/100 km is good for a compact electric vehicle, below 14 kWh is efficient, and above 20 kWh is generally considered a sign of a large and heavy body. This figure shows how much energy the vehicle draws from its battery over 100 kilometers; range estimation, cost calculation, and comparison between models are all done through this single number. In this article, we take a step-by-step look at how to read that number correctly, the difference between the WLTP label and real-world use, and how to calculate your own cost per 100 kilometers based on your usage profile.
Highlights
- Real-world consumption range: 14-21 kWh/100 km
- In BEVs, real consumption is on average 1-20% higher than the laboratory value
- City driving recovers approximately 3 times more energy through regenerative braking compared to highway driving
- Sample cost per 100 km with a home tariff: approximately 41 TL
- Winter range can drop 10-23% compared to WLTP
What Exactly Does kWh/100 km Measure?
kWh/100 km is the amount of electrical energy a vehicle consumes every 100 kilometers, and it is the equivalent of L/100 km in gasoline vehicles in the world of electric vehicles. While gasoline is measured in liters, electricity is measured in kilowatt-hours; 1 kWh is the energy consumed by a device running at 1 kilowatt for 1 hour. From an engineering standpoint, this figure is very useful because it allows you to weigh two vehicles with different battery sizes on the same scale: if a large 60 kWh vehicle consumes 18 kWh/100 km and a compact 50 kWh vehicle also consumes 18, the two are equal in terms of efficiency - even if their ranges differ.
The range calculation also follows directly from this figure. The formula is simple: divide battery capacity by consumption and multiply by 100. For example, a vehicle with a 60 kWh battery consuming 17 kWh/100 km gives a range of approximately 352 km. The reverse of the same formula also works: if you know your range and estimate your consumption, you can predict how far you can go until the next charge.
Is the WLTP Value the Same as the Dashboard Value?
No, and this distinction is the source of most confusion. WLTP is a laboratory test that replaced NEDC in 2017: it runs on a dynamometer, at an ambient temperature of 23 °C, with a four-phase 30-minute cycle. The phases are divided into Low (max 56.5 km/h), Medium (max 76.6 km/h), High (max 97.4 km/h) and Extra High (max 131.3 km/h); the cycle average is 46.5 km/h. Air conditioning and heating are not used in this test.
The critical point is this: WLTP consumption is based on the energy drawn from the grid, meaning it also includes charging losses - this loss is typically around 7-12%, and even worse in cold weather. The kWh/100 km value on the dashboard, on the other hand, measures only the energy drawn from the battery; it does not cover charging losses. Since the two values measure different things, they cannot be directly compared, and many comparisons on the internet make a mistake at exactly this point. Also, the "city range" in brochures uses only the Low and Medium phases, meaning it assumes driving below 60 km/h; this makes it an optimistic figure that fits very few usage profiles.
How Big Is the Real-World Difference?
In practice, the picture is clear: the real consumption of electric vehicles is on average 1-20% higher than laboratory figures, and the average range loss is around 16% . In a large measurement study covering Europe as a whole, certified consumption 19±4 kWh/100 km emissions; actual consumption is 21±4 kWh/100 km. Winter conditions make the picture even harsher: in tests between 0 and -10 °C, range comes out 10-23% lower than WLTP.
In contrast, the difference is not the same in every vehicle. In real-world test programs, some models deviate from WLTP by only 8% (for example, the Kia EV6 and Tesla Model Y Long Range), the Tesla Model 3 deviates by 14%, the Kia EV3 by 11% and the BYD Atto 3 by 12% . It has also been measured that some vehicles achieve up to 109% of their WLTP range value; in other words, WLTP is not optimistic for every vehicle, but it is optimistic overall. As a practical rule of thumb in Türkiye, subtracting 20% from WLTP is a healthy starting point for long-distance planning.
How Does Regenerative Braking Change City and Highway Consumption?
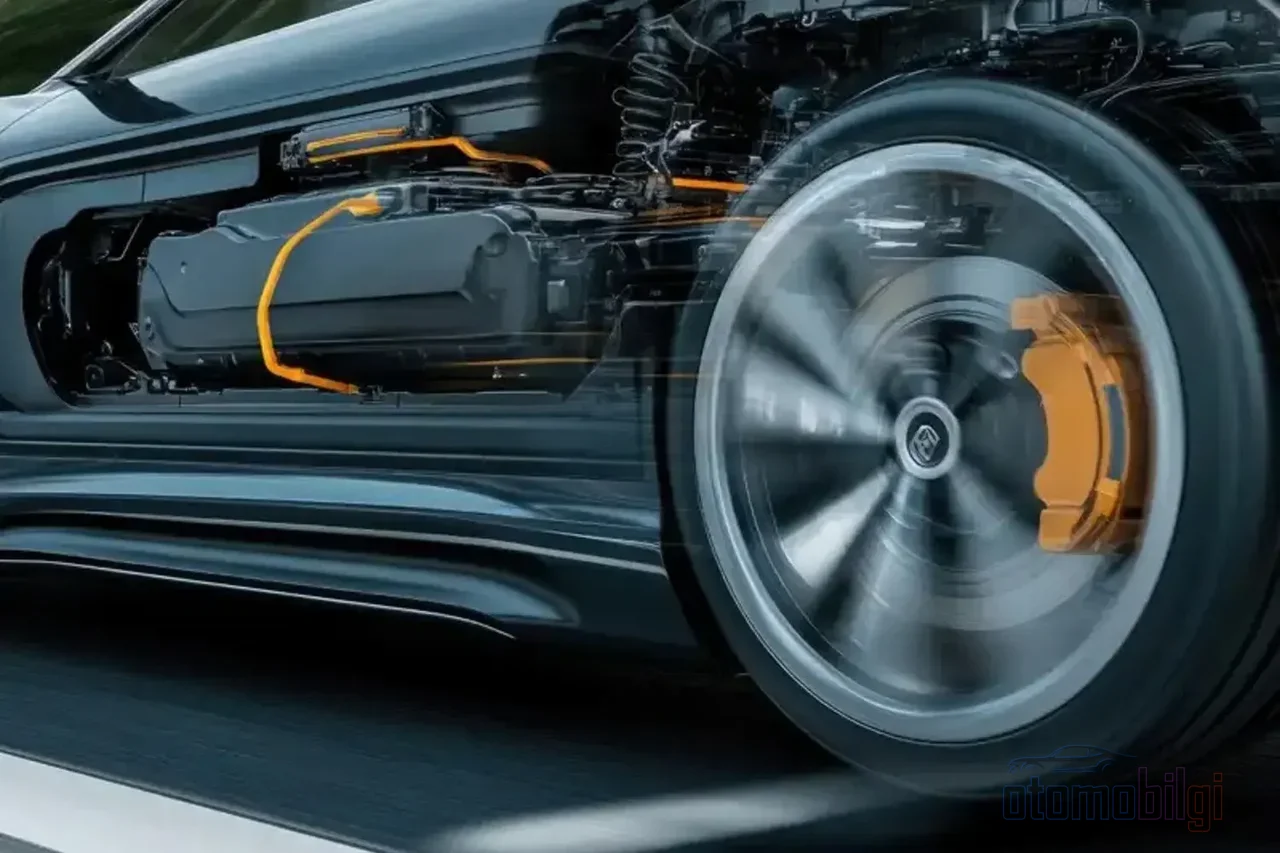
The behavioral difference of electric vehicles compared to gasoline cars emerges here: stop-and-go city driving is a penalty for a gasoline car, but an advantage for an electric one. The reason is regenerative braking - when you release the accelerator or brake, the electric motor turns into a generator, recovers the vehicle's kinetic energy and sends it to the battery. City driving recovers almost 3 times more of this energy than highway driving; downhill driving is the most efficient scenario. Through accelerator release and braking moments, up to 15% of energy can be recovered in the city and on hills, and this is the most concrete key to reducing urban consumption. Academic studies also confirm that higher regeneration levels provide better energy efficiency.
On the highway, however, the picture reverses. Since stop-and-go decreases, the energy that can be recovered also decreases; on top of that, aerodynamic drag rises exponentially as speed increases, and the electric vehicle loses part of its efficiency advantage over gasoline cars on the highway. At 120 km/s, consumption increases by 20-30% compared to city driving. The result is a picture in which gasoline car habits are reversed: the natural home of the electric vehicle is the city and slow traffic, while the long journey is a special case requiring charging planning.
Which Value Is Good? Segment-Based Consumption Ranges
The definition of "good" varies by segment, because weight and air resistance physically determine consumption. The general framework is this: efficient electric vehicles consume around 13-16 kWh/100 km , while large and heavy models stay at 20 kWh and above. As examples of the most efficient models, the Fiat 500e with 13.6 kWh/100 km and the Hyundai Kona Electric with values around 14.8 kWh in WLTP can be given.
| Segment | Real consumption | Character |
|---|---|---|
| Urban compact | 14-16 kWh/100 km | The class that benefits most from regeneration |
| Compact / family | 16-18 kWh/100 km | Typical balanced value for general use |
| Electric SUV | 18-21 kWh/100 km | The weight and aerodynamic drag penalty is clearly visible |
The expected range for typical compact electric vehicles in Türkiye is similar: 14-18 kWh/100 km; an overall average of 15-20 kWh/100 km is accepted. With regeneration in city traffic, this value can drop even lower. One warning when reading this table: you may come across the CLTC test standard on Chinese-origin vehicles. CLTC is noticeably more optimistic than WLTP; the conversion factor is approximately 0.82 - meaning a 420 km CLTC range roughly corresponds to 340 km WLTP. You need to apply this correction in your head when making comparisons with CLTC figures.
Ranking of Factors That Increase Consumption
All the fluctuations in the consumption display can be attributed to a cause. Ranking the effects by magnitude goes like this:
- Speed: The single biggest factor. Above 110 km/h, aerodynamic drag increases exponentially; simply going from 100 to 110 km/h increases drag by approximately 33% due to the cube law.
- Temperature: Lithium batteries 15-25 °C work best in this range. In winter, internal resistance increases and cabin heating draws extra energy from the battery; with air conditioning cooling, range can drop 35-50%, and with heating approximately 50% . Preconditioning done while charging at home (heating/cooling the cabin powered from the grid) prevents a significant portion of this loss.
- Load: Every additional 100 kg reduces range by 1-3% .
- Other factors: Low tire pressure increases consumption by approximately 3% ; wind, traffic, and road profile are also reflected in the picture.
- Battery aging: Annual 2-3% degradation means a range loss of 10-15% over 5 years.
The remaining range estimate on the dashboard should also be read in this context: this dynamic estimate found in many vehicles is based on consumption in the last few kilometers and is continuously updated - it is not a firm commitment, but an estimate adjusted according to recent conditions.
How to Calculate the Cost of 100 km in Türkiye?
The cost calculation consists of three variables: consumption, tariff, and charging loss. First put in the consumption: 16 kWh/100 km is a reasonable assumption for a typical compact. Then the tariff: in residential tariffs in 2026, an average band of 2.33-3.45 TL per kWh is seen; the lower tier is approximately 2.59 TL/kWh, the higher tier approximately 3.89 TL/kWh, and around 2.4 TL/kWh in the three-time-of-day night tariff. If you can use the night portion of the three-time tariff, that is the cheapest way to charge at home.
A simple example calculation: a vehicle consuming 16 kWh/100 km produces an energy cost of approximately 41 TL per 100 kilometers at a home tariff of 2.59 TL/kWh. If you want a more accurate calculation, also add the charging loss: while fully charging a 60 kWh battery, assuming 10% loss, you draw approximately 66 kWh from the grid - meaning the energy reflected on your bill is slightly more than what enters the battery.
The charging station side is a separate column: as of August 2026, AC charging is 9.90-11 TL/kWh, DC fast charging 12.90-15.95 TL/kWh band. In other words, charging at home on the night tariff makes a clear difference per 100 km compared to DC fast charging; bringing fast charging, which is inevitable on long journeys, into daily use raises the cost unnecessarily. For comparison: petrol cars consume on average 6-7 L/100 km and with current petrol prices, the electric side's advantage becomes clear in home charging.
Estimating Real Range and Cost with Your Own Usage Profile
A three-step method is enough to translate all these variables into your own usage:
- Choose your base consumption: Take the range corresponding to your vehicle from the segment table; 16 kWh/100 km is a reasonable midpoint for a compact.
- Apply the profile correction: In weighted city use, regeneration works in your favor; on highways weighted toward 120 km/h you can add 20-30%. Plan an extra 15-25% loss in winter, and don't forget the effect of air conditioning in summer.
- Calculate the cost according to your tariff: Multiply the corrected consumption by your price per kWh; use the residential tariff for home charging and the DC price for en-route charging.
The same logic applies to long-distance trip planning. Plan your charging stops in advance, don't assume "I'll find one there"; deliberately calculate your range conservatively - for a vehicle rated at 543 km WLTP, working with 500 km in your head is a healthy buffer. If you tie charging breaks to coffee and meal stops you're going to make anyway, the waiting time effectively drops to zero. In daily use, keeping the battery %20-80 is a good habit for battery health; only charge to 100% right before a long trip. Factoring in winter range loss when the cold season approaches is part of the same discipline.
Is a Single Number Enough? Conclusion
WLTP gives a single number, whereas the same vehicle's consumption varies across a wide band depending on temperature, speed, and load. That's why some argue it would be fairer for manufacturers to publish a range band based on topography, temperature, and speed rather than a single range value; there's a valid point there. Let me also add: the WLTP-to-real-world gap has been visibly narrowing over the years as real-world testing programs have become widespread. And one warning: for PHEVs, WLTP consumption figures deviate to an unreliable degree - in real use they can consume roughly 3.5 times more fuel than the label suggests, because the electric driving share stays at only 11-15% in company vehicles.
The practical outcome rests on engineering logic: 16 kWh/100 km is a healthy definition of "good" for a compact vehicle, below 14 is outstanding efficiency, and above 20 is the price of weight and air resistance. When you combine this figure with the WLTP-to-dashboard gap, the effect of regeneration, and your own driving style, you end up with a range and cost estimate that belongs to your own usage, not to the brochure number. This reduces range anxiety to a manageable planning problem - and the right solution to that is not driving faster, but calculating better.
Sources
- WLTP Explained
- Electric Car Consumption 2026 | kWh/100km and Real Range
- Energy Consumption of Electric Vehicles in Europe (Weiss 2024)
- Comparison of real-world energy consumption and WLTP declared values
- Sticker Shock: The Real-World Range Of Electric Vehicles
- How to Maximise EV Range with Regenerative Braking
- EV energy consumption
- Regenerative Braking Systems in Electric Vehicles (Szumska 2025)
- Comparative Analysis of Electric Vehicle Energy Consumption
- Models with the Lowest Electricity Consumption Among Electric Cars
- Electric Vehicle Charging Fees 2026
- Electric Vehicle Expenses 2026
- Electric Vehicle Charging Cost
- 2025 Real Range Results Report
- Effect of Air-Conditioning on Driving Range