491,000 Electric Vehicles and 49,000 Charging Sockets in Türkiye: Is the Infrastructure Keeping Up?
Share This Page
As of September 2026, the number of electric vehicles in Türkiye reached 491,492, while the number of commercial charging sockets reached 48,971 ; meaning that for roughly every 10 electric vehicles on the road there is 1 public charging socket . While the vehicle fleet grew by 52.8 percent over the past year, the number of sockets increased by 39.9 percent; this gap is the clearest sign that infrastructure investments have not yet fully kept pace with the tempo of sales. Below, we examine the Energy Market Regulatory Authority's September charging services market data, along with the trends behind the figures.
Highlights
- The number of electric vehicles rose to 491,492 in September; a monthly increase of 3.1 percent.
- The number of commercial charging sockets is 48,971: 27,664 AC, 21,307 DC.
- Total installed capacity is 3,875 MW; a yearly increase of 49.7 percent - below the growth in vehicles.
- September consumption was 83,253 MWh; a 14.6 percent decline compared to the August record.
- Of consumption, 61.89 percent came from YEK-G certified green charging.
What the Numbers Say: The September 2026 Picture
EPDK published the September Monthly Statistics of the Charging Services Market on October 16; the data is based on TUIK vehicle registrations. Accordingly, in the transition from August to September, the number of vehicles rose from 476,934 to 491,492, and the number of sockets from 47,908 to 48,971. On a monthly basis, vehicle growth was 3.1 percent, socket growth 2.2 percent. The difference is small but the direction is the same: the fleet is running ahead of the network.
Total installed capacity reached 3,875 MW. The year-on-year comparison tells the real story: in September 2025, there were 321,710 electric vehicles and 35,002 sockets. In one year, 169,782 vehicles joined the fleet - a 52.8 percent increase. Over the same period, only 13,969 sockets were added to the network; 39.9 percent. This difference between the two growth rates is the most honest answer to the question "is the infrastructure keeping up?"
| Indicator | September 2025 | September 2026 | Yearly change |
|---|---|---|---|
| Electric vehicles | 321,710 | 491,492 | 52.8% |
| Charging sockets | 35,002 | 48,971 | 39.9% |
| AC sockets | 19,992 | 27,664 | ~38.4% |
| DC sockets | 15,010 | 21,307 | 42% |
| Installed capacity per vehicle | 8.05 kW | 7.89 kW | Decline |
The last row in the table is a familiar sight for anyone who has been following this field for years. Although installed capacity rose by 49.7 percent year-on-year, the number of vehicles grew faster, so the capacity per vehicle fell from 8.05 kW to 7.89 kW. On its own, it is not a disastrous figure; but the trend stands as a warning light that must be monitored until it reverses at least once. As long as the ratio deteriorates, even if the network grows, capacity per vehicle decreases.
Fast Charging or AC? The Inside Story of the Distribution
Of the 48,971 sockets, 27,664 are AC and 21,307 are DC. Although AC appears to lead in socket count, the weight of investments has clearly shifted toward fast charging: the number of DC sockets increased by 42 percent in one year, while AC sockets rose by 38.4 percent. This shows the sector is approaching from the right direction, because usage data points in the same direction.
In September, 82.44 percent of total consumption was DC took place at sockets; AC's share remained at 17.56%. A similar picture emerges in transaction counts: 74.64% of charging transactions are fast charging. Average consumption per transaction is 29.17 kWh for DC and 18.28 kWh for AC. In other words, users mostly charge on the road, taking on high energy in a short time. AC sockets come into play more in scenarios with long parking durations. It should also be noted that with the commissioning of 350 kW-class stations the previous year, the fast charging race gained another dimension, and this segment became widespread in 2026.
The hourly distribution of charging transactions also reflects a typical traffic pattern: the busiest time slot is between 17:00 and 18:00, with 5,730 MWh of consumption in that hour. The calmest moment is between 04:00 and 05:00, at 725 MWh. Evening return traffic intensity is a figure operators should place at the center of their focus, both for grid management and station placement.
Why Did Consumption Decline? Reading Monthly Fluctuations Correctly
In September, commercial charging consumption fell to 83,253 MWh; 14.6% below the record 97,469 MWh recorded in August. The number of charging transactions also dropped by 10.6%, from 3.53 million to 3,152,733. At first glance, this may give the impression of a network emptying out; but reading a single-month decline as reduced usage would be hasty.
Several factors are at play here simultaneously. First, a significant portion of electric vehicle owners do their daily charging at home or at work; these charges do not appear in commercial statistics. The commercial network's share can fluctuate as the vehicle fleet grows and user habits settle. In addition, the normalization of road usage in September following the summer holiday traffic naturally balances demand. The averages remain stable: per transaction 26.41 kWh and 1.13 hours. The network is working; the question is whether it will offer sufficient flexibility at demand peaks.
Geography is also an important heading. Istanbul carries 26.89% of consumption on its own with 22,383 MWh. Ankara holds a 13.28% share with 11,057 MWh and grew 3.3% on a monthly basis; Izmir with 5,094, Bursa with 4,299, and Antalya with 3,699 MWh complete the top five. This concentration also explains why new investments flow primarily to the three largest cities; yet uninterrupted charging on the highway network remains a persistent question for long-distance travel by electric vehicle. Operators: Whose Network Is Bigger, Whose Power Is Higher?
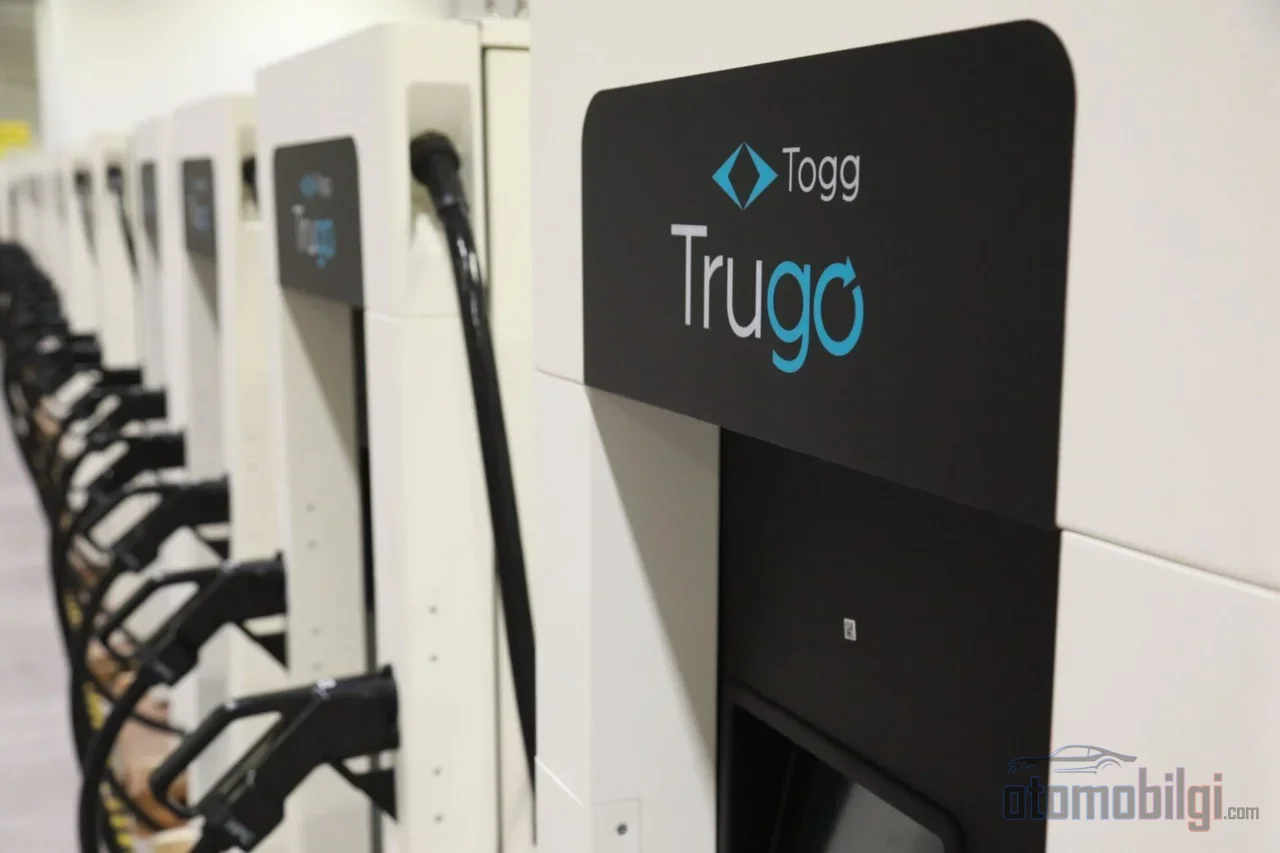
Since the market does not show a clear monopolization, multiple players continue to exist with varying degrees of success. In the consumption ranking, Trugo ranks first in September with
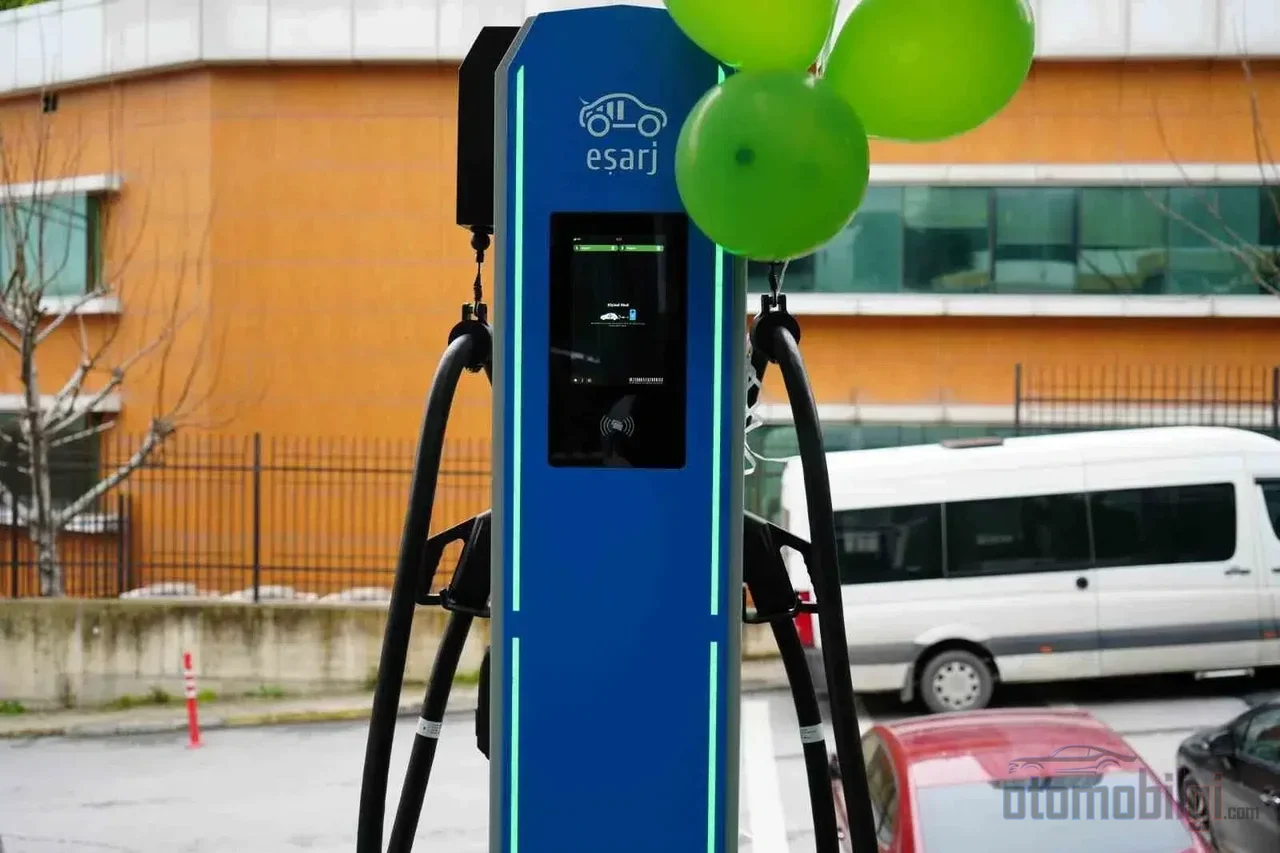
18,543 MWh and a 22.27% share. Zes follows in second with 13,885 MWh and 16.68%; Esarj with 5,107 MWh, Wat Mobilite with 3,966 MWh, Astor with 3,664 MWh, and Tesla with 3,510 MWh trail them. takes the lead with a 22.27% share. Zes follows in second with 13,885 MWh and 16.68%; Esarj with 5,107 MWh, Wat Mobilite with 3,966 MWh, Astor with 3,664 MWh, and Tesla with 3,510 MWh trail them.
When it comes to socket count, the leadership changes: Zes has the widest network with 5,553 sockets (2,861 AC / 2,692 DC). Trugo is second with 4,200 sockets; but there is a notable detail - 3,375 of Trugo's network is DC, meaning a structure weighted toward fast charging. Voltrun with 2,719, Wat with 2,416, Eşarj with 2,072, and Zeplin with 1,735 sockets complete the first group. The fact that the consumption ranking and the network size ranking do not overlap shows that occupancy, not sockets, is what matters; location and power level tell you more than sheer numbers.
On the green charging side, a notable threshold has also been passed. From stations certified under YEK-G, 51,522 MWh of energy was delivered; that is 61.89 percent of total consumption. The carbon concerns of electric vehicle buyers now have a tangible, measurable counterpart on the grid - a few years ago, speaking of such a rate was not possible.
Market Context: As Sales Slow, What Should the Infrastructure Do?
According to ODMD data for September 2026, 15,074 electric cars were sold; the share of electric vehicles in car sales reached 23.7 percent, and sales grew by 18.6 percent year-on-year. In contrast, the overall market shrank by 24.33 percent in the same month, falling to 83,469 units. In the first nine months of the year, the total automotive market declined by 15.45 percent. The fact that the electric segment is growing its share while the overall market contracts shows that this segment is no longer a niche but mainstream; in the first half of 2026, 81,331 electric cars had been sold, with market share rising to 18.5 percent.
There are minor differences between sources in the model rankings; such lists can vary depending on definitions and compilation time. The common picture is this: Togg's total sales in September were reported as 6,692 units, with the T10X and T10F at the top. In one compilation, the Togg T10X leads with 1,832 units, followed by the T10F with 1,673; according to another list, the Tesla Model Y moves ahead with 1,664 units, followed by the T10F (1,194), T10X (1,061), Kia EV3 (880), and BYD Atto 3 (713). The difference lies in which model ranks where; they agree on who the leading brands are.
Now, back to the main question: is the infrastructure keeping up with this sales pace? The vehicle count is increasing by 170,000 per year; the socket count by roughly 14,000 per year. The math is simple and brutal: each month, the sockets added to the network fall short of the needs of the vehicles joining the fleet. On the other hand, there are two mitigating factors. First, the 49.7 percent increase in installed capacity shows that the power side has grown as much as the socket count, and that stations are on average shifting to higher wattage classes. Second, the prevalence of home and workplace charging keeps the load on the public network at a sustainable level. The problem today is not in the queue; it is in the rate at which the ratios are deteriorating. Whether the installed power per vehicle indicator turns back up from the 7.89 kW level in the coming quarters will say, in the purest form, whether infrastructure investments are catching up with the sales pace.
Viewed from the perspective of many years, the picture is by no means to be dismissed: in 2022, Türkiye had 14,896 electric vehicles. Today that number has grown thirty-three-fold, and the charging network has reached an installed capacity of 3,875 MW from scratch. The debate used to be about "whether there is charging for intercontinental journeys"; now the debate is about peak-hour congestion and the balance of ratios. This is a positive sign in terms of the direction of progress - but not before the gap closes.
Conclusion: Relief Is Hard Before the Ratio Improves
September 2026 data shows that Türkiye's electric vehicle ecosystem is growing rapidly, but that this growth is not balanced. The vehicle fleet grew by 52.8 percent and the socket network by 39.9 percent, while installed capacity per vehicle declined. The investment weight on the DC fast-charging side and ratios such as a 61.89 percent share of green energy prove that the quality of the network is rising. The remaining task is for quantity to catch up with quality - in other words, for socket and capacity ratios per vehicle to turn back toward improvement. Until that turnaround begins, the question "is the infrastructure keeping up" will not leave the agenda; and frankly, its staying on the agenda is not a bad thing for the industry either.
Sources
- EMRA Monthly Charging Service Market Statistics
- ODMD Press Release, September 2, 2026
- Electric vehicle count exceeded 491 thousand: Trugo leads in consumption
- EMRA September 2026 data: Electric vehicle charging consumption and Ankara analysis
- EMRA January 2026 Electric Vehicle and Charging Market Data
- September 2026: How Many Cars Were Sold in Türkiye
- 2026 automotive sales: The market shrank, electric cars
- Electric Vehicle Market First Half of 2026